

Edited March 11 2011 - content added below ice prediction chart to address points raised in readers' comments.
The Arctic sea ice extent has grown a little recently. Ice extent as of March 10 2011 is 13749688 km2 (as reported by IJIS). Ice extent commonly grows until the end of March. But any ice which forms now will still be very young, thin, salty ice when the temperatures begin to rise - not forgetting that temperatures are already anomalously high over much of the Arctic.
While ice extent grew at average rates for February, the overall extent remained anomalously low. Air temperatures over most of the Arctic Ocean were between 2 and 4 degrees Celsius (4 and 7 degrees Fahrenheit) higher than normal. Over the East Greenland Sea and north towards the Pole, air temperatures were 5 to 7 degrees Celsius (9 to 13 degrees Fahrenheit) higher than normal. Colder conditions, 2 to 6 degrees Celsius (4 to 11 degrees Fahrenheit) below average persisted over western Eurasia, east-central Eurasia and some of the Canadian Arctic.Looking at extent graphs and charts doesn't give the whole picture. For example, this comparison of March 2011 with March 2007 shows little significant difference.
Arctic sea ice news March 2, 2011
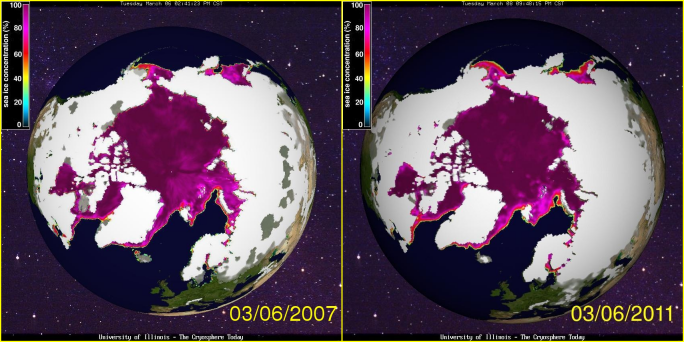
Cryosphere Today images comparing 2007 and 2011.
images source: http://arctic.atmos.uiuc.edu/cryosphere/
Taking volume into account paints a different picture.
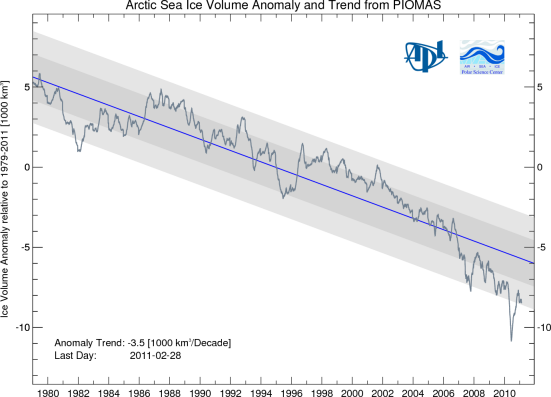
Monthly average Arctic Ice Volume for Sept 2010 was 4,000 km3, the lowest over the 1979-2010 period, 78% below the 1979 maximum and 9,400 km3 or 70% below its mean for the 1979-2009 period.Image and text source: http://psc.apl.washington.edu
Images from NASA confirm a recent change in age distribution and volume.
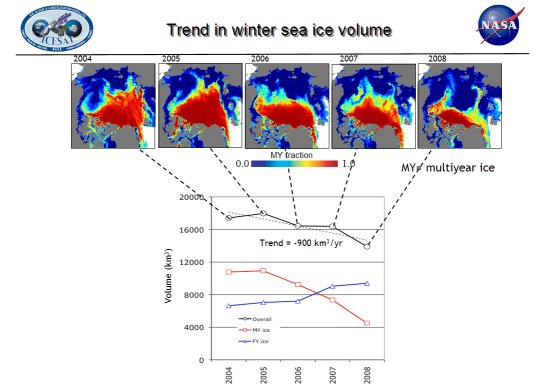
ICESat measurements of winter multi-year ice cover in the Arctic Ocean between 2004 and 2008, along with the corresponding downward trend in overall winter sea ice volume, and switch in dominant ice type from multi-year ice to first-year ice.Credit: Ron Kwok, NASA/JPL
http://www.nasa.gov/topics/earth/features/icesat-20090707.html
Note that the age of ice is a good proxy for volume, and vice versa, only for as long as the ice is not subjected to substantial melting. The usual patterns of circulation take young ice into the pack where it takes some years to escape again, meanwhile rejecting salt, growing and compacting. Climate change means that we can no longer rely on former norms: rather, we should expect something other than former norms. Instead of ice being trapped in the main pack it is being ejected from the main pack. The older ice survives where it is ejected against the Canadian archipelago / Greenland coasts - but only while the many channels to Baffin Bay remain closed. Once they open, displacement patterns such as the one shown below will promote rapid ejection of ice.
PIPS2.0 Ice displacement forecast 03 March 2011
image source: http://www7320.nrlssc.navy.mil/pips2/
Recent changes in the Arctic ice floe circulation have caused younger ice to be exported before it can become greater than about 5 years old. As I have stated previously: the Arctic ocean is populated by floes of various ages. As older ice gets exported it gets replaced by younger ice. The net result is a younger ice cap. It is now mostly 1st year ice, i.e. salty, weak, relatively thin ice. The image below shows that the ice gets thicker on average towards the coasts mentioned.
Ice thickness in meters
image source: http://www7320.nrlssc.navy.mil/pips2/
Nares Strait / Kane Basin
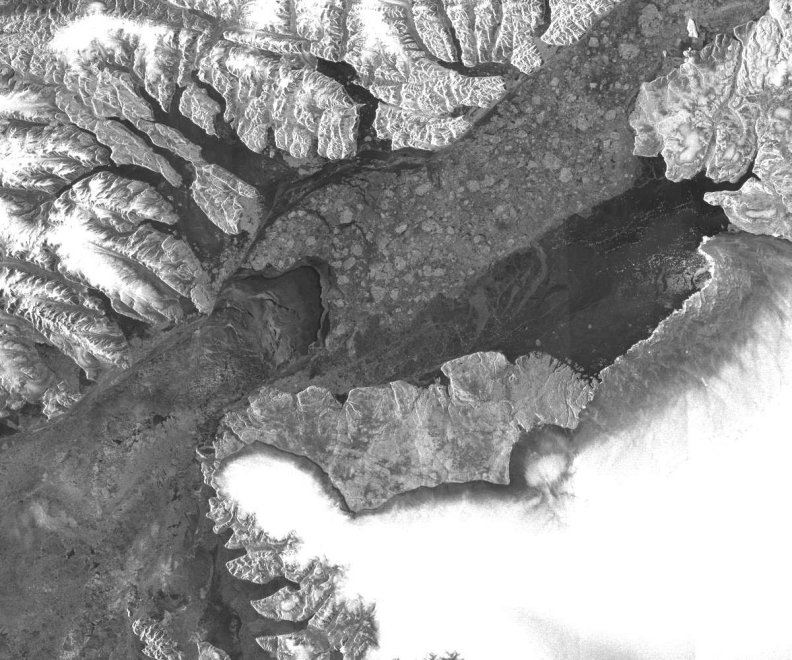
Although an ice bridge formed in Nares Strait this winter, it is very weak structurally. The Kane Basin is covered predominantly in 1st year ice. When this melts the ice bridge will collapse. Signs of melt are highlighted in the MODIS image below.
Thin snow cover reveals thin ice in the Kane Basin ice
image cropped, source: http://rapidfire.sci.gsfc.nasa.gov/
The Kane Basin as seen by ASAR
image re-sized, source: http://ocean.dmi.dk/arctic/images/MODIS/
Some important observations
The Arctic melt season begins with these anomalous parameters:
Ice extent as of March 10 2011: 13749688 (as reported by IJIS)
low total ice volume;
low older ice volume, mostly confined to a relatively small area;
high temperatures generally;
high mobility - i.e. loose pack;
a majority of 1st year ice.
Those anomalies need to be seen in the context of steep downward trends in minimum ice extent, volume and age - together with less steep downward trends in maximum extent, volume and age. By way of example, The Cryosphere Today 'tale of the tape' shows that negative anomalies have, since 2003, not been offset by positive anomalies. The trend is obviously and inexorably pointing downwards.
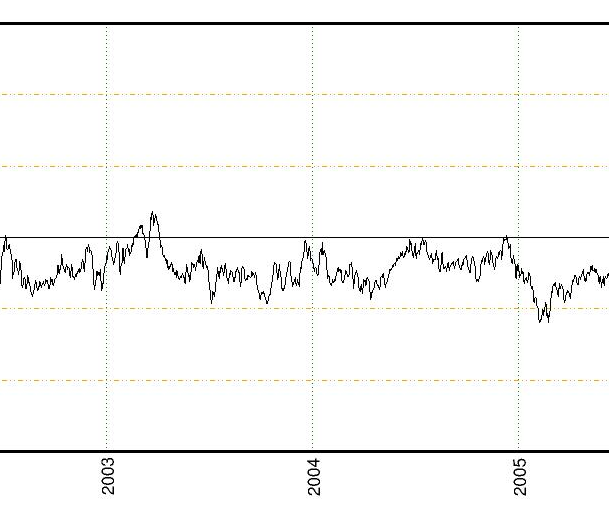
The last significant positive anomaly was in 2003
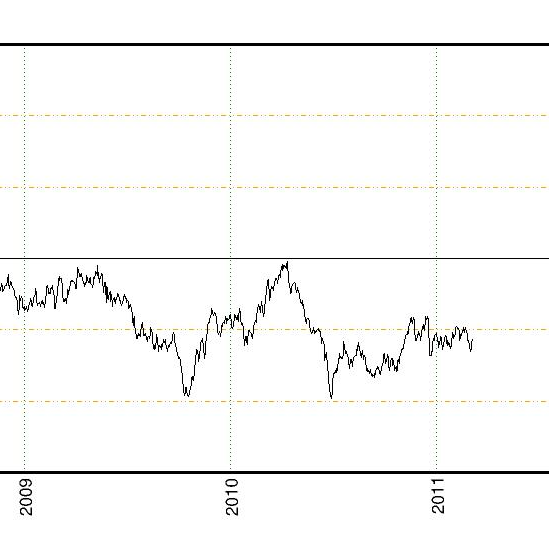
The anomaly so far this year is more negative than of recent years.
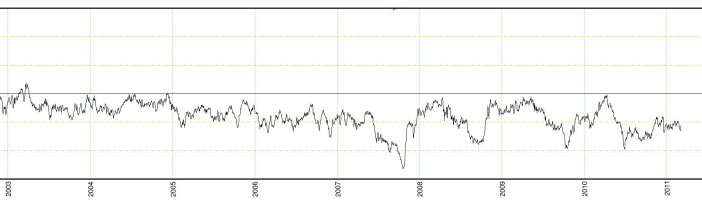
Three years of 'recovery' since 2007 have failed to establish a recovery trend.
From an original graphic 'tale of the tape' at Cryosphere Today -
http://arctic.atmos.uiuc.edu/cryosphere/
Pacific sector
The general area around the Bering Strait showed a late spurt in ice formation last April. At the time of writing the sea ice in that area is thinner and more mobile than last year. The snow cover on the land is slightly less, but the thick snow cover on the ice of March 2010 is almost entirely absent. The melt season in that region begins with an albedo much lower than this time last year.
The following image compares the Bering Strait area as of March 07 2011 with that of March 12 2010. The later date for 2010 was selected for its minimal cloud cover.
Bering Strait March 2011 and March 2010 compared
images source: http://rapidfire.sci.gsfc.nasa.gov/
Prediction
Last year's Arctic weather shifted in July and reduced the export of ice. Had the 2010 trend continued through July and August, much more extent would have been lost. However, despite the weather shift, extent, volume and age all continued to decline.
If the 2010 April - June trends applied this year 2011 from April to August, the extent could drop to somewhere around 50% of 2007 extent. I consider that, if the summer melt follows recent average trends, the September extent will almost certainly be below 4 million km2. Below 3.5 is plausible.
I have still to find the time and energy to produce some numbers. Meanwhile, here is a chart showing my broad prediction for September 2011. It is modified from the NSIDC ice chart for 2007 minimum extent which was 5.65 million square kilometers (2.18 million square miles).
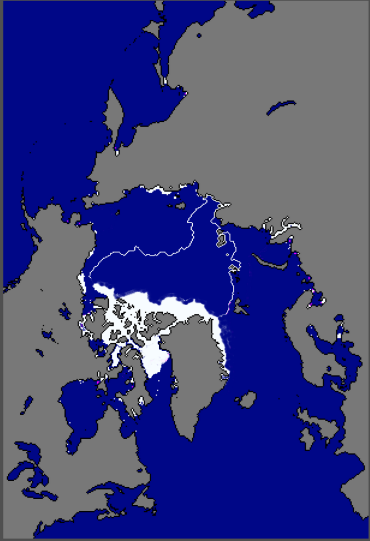
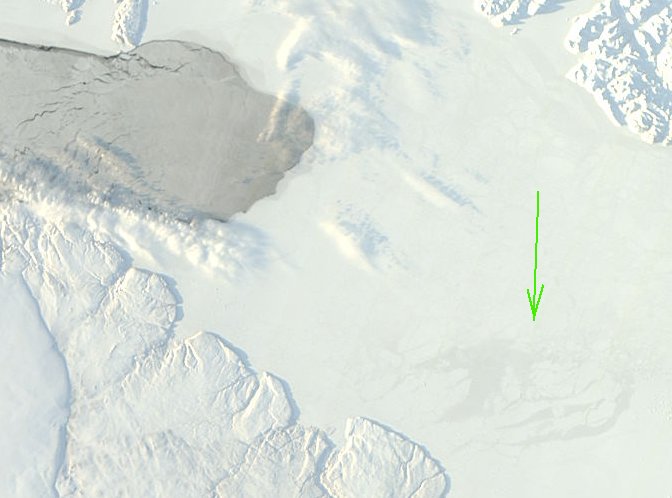
My prediction of September 2011 ice extent compared with 2007 minimum.
Edit - added content:
The chart is a polar projection onto which I have mapped ice by hand for purposes of illustration only. It should not be taken as an exact plot. The area in solid white is the area within which ice concentration will be at least 15%. Put another way, the area will contain areas of open water up to 85%.
Here are my most recent predictions:
Unless the Arctic sees unusually low temperatures before April 2011 - an unlikely event - it is highly likely, I suggest, that the central Arctic ocean will be virtually ice free by the end of Summer 2011.
October 26th 2010
Arctic Ice November 2010
I expect the [Nares Strait] ice bridge to break up between 2 to 4 weeks from now - earlier if there are any strong gales coming down the Strait.My term 'area along the coasts' implies that all passages between islands will contain advected ice.
...
If the general trend towards earlier melting continues this year, I expect the main NWP to be open as a passage for ice export by mid June to end of June.
...
I expect that a great deal of ice will be lost via Fram Strait, Nares Strait and the Canadian archipelago. By September the bulk of sea ice will remain only in the area along the coasts of the Canadian archipelago and Greenland, with an extent of substantially less than 4 million km2. - perhaps less than 3 million km2.
By September there will be virtually no ice left in the Arctic ocean older than 2 years.
The ice which remains will be almost entirely 1st year ice.
March 02 2011
Arctic Ice March 2011
To clarify my forecasts:
an extent below 4 million km2 is highly probable.
an extent below 3 million km2 is entirely possible if Arctic weather continues to follow the overall trends of the last decade.
End of edit.
Many scientists are now examining the serious possibility of a seasonally ice-free Arctic sometime between 2013 and 2016. Discussion is now moving away from 'will the Arctic lose all of its sea ice?' to 'what are the likely outcomes when the Arctic loses all of its sea ice?'.
When all her robes are gone1
I doubt that anyone will wax lyrical about an ice-free Arctic. It will not be a thing of beauty. Perhaps future poets may say of this generation - a generation fixated on fossil fuel consumption and blind to the dangers - 'thus hath the candle singed the moth'.
We cannot tell precisely, region by region, what the climatic effects will be of an ice-free Arctic. But we can make some intelligent and informed estimates of likely or possible scenarios. I distinguish 'likely' from 'possible' because I want to separate the need for action from excuses for inaction. But that is a matter for a later article. Meanwhile, I welcome my reader's responses to the question: "What are the possible and/or likely climatic effects of an ice-free Arctic ocean?"
Footnotes
[1] By an anonymous poet:
MY Love in her attire doth show her wit,
It doth so well become her:
For every season she hath dressings fit,
For Winter, Spring, and Summer.
No beauty she doth miss
When all her robes are on;
But Beauty's self she is
When all her robes are gone.
[2] - William Shakespeare - Merchant of Venice, Act 2, scene 10.
Thus hath the candle singed the moth.---------------------------------------------------------
O, these deliberate fools! when they do choose,
They have the wisdom by their wit to lose.
Further reading / related
Arctic Ice 2011 - Sail, Steam And Satellites
Arctic Ice March 2011
The ChatterBox Arctic Index
Arctic Sea Ice
http://climateprogress.org/2010/09/08/arctic-sea-ice-history-paleoclimate-polar-amplification/


Comments