

As I write these words - September 01 2010 - Arctic sea ice extent as reported by NSIDC and JAXA is not as low as I had expected it to be.
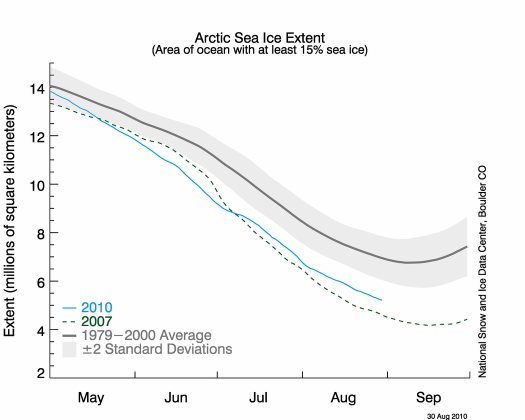
image source: http://nsidc.org/arcticseaicenews/
.
The IARC-JAXA graph shows 2010 extent as 4th lowest of recent years thus far, behind 2007, 2008 and 2009.
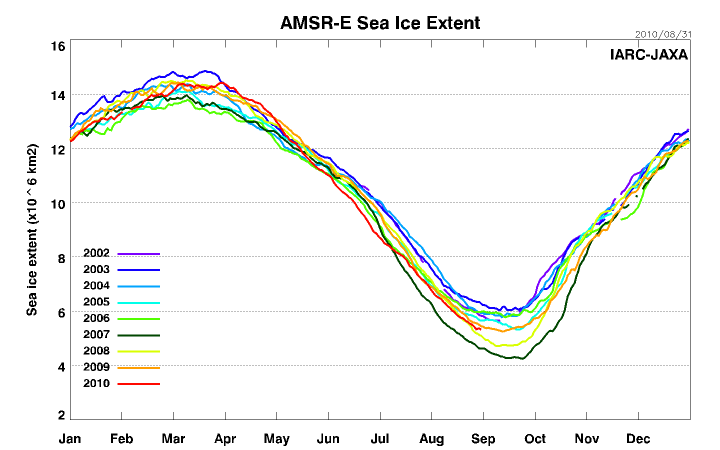
image source: http://www.ijis.iarc.uaf.edu/en/home/seaice_extent.htm
.
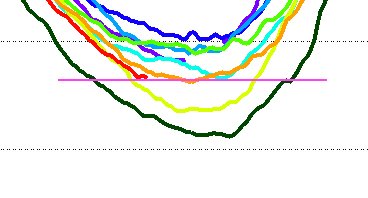
This detail, with a magenta horizontal lime added, shows the lowest extents more clearly:
My last two forecasts of sea ice extent over-estimated the extent loss. What went wrong? The year started out with a delayed maximum extent - a small growth in early April - and then the extent started to decline rapidly. Having regard to all of the feedbacks which would impact on ice melt I had expected that the 2010 extent, having dropped sharply below the 2007 figures, would continue to decline rapidly. The erratic behavior of winds, of the Beaufort Gyre and Transpolar Drift have reduced the extent loss by a fairly large amount. But the ice has been melting fast.
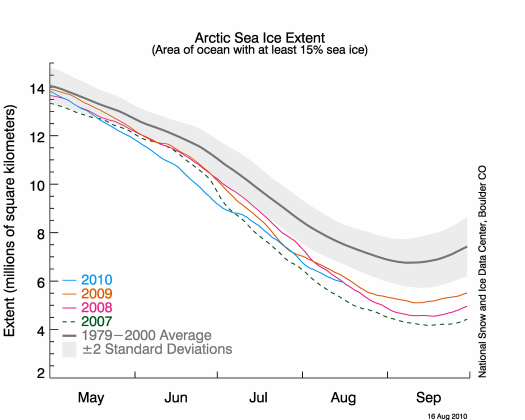
The graph above shows how the 2010 extent drop has slowed down. I had expected it to continue below the 2007 line, based on the observation that 2007 minimum extent still showed great amounts of ice in the Canadian Archipelago and along the east coast of Greenland.
Sea ice extent is the measure of the total ocean area within which there is at least 15% ice cover. Put another way it is the area within which there is no more than 85% open water.
If we start with 100% ice cover and keep melting or exporting ice, then for as long as the ice fragments keep moving into the gaps we could well see 100% extent until the whole area contains only 15% ice. A graph of extent against time in these conditions would be a straight horizontal line. A naive interpretation of the graph would show no ice loss. Even a layman's interpretation of the view from space would show dramatic ice loss.
What has happened this year is that the ice has fragmented and thinned greatly, but so much of it has expanded to fill the gaps left by melted ice that the extent figures do not show the true state of the Arctic. The ice has thinned and spread out, so the extent figures give no hint of the huge volume loss.
The following comparison of six years using Cryosphere Today images shows how little old, thick ice remains this year as compared with the years from 2005 to 2009.
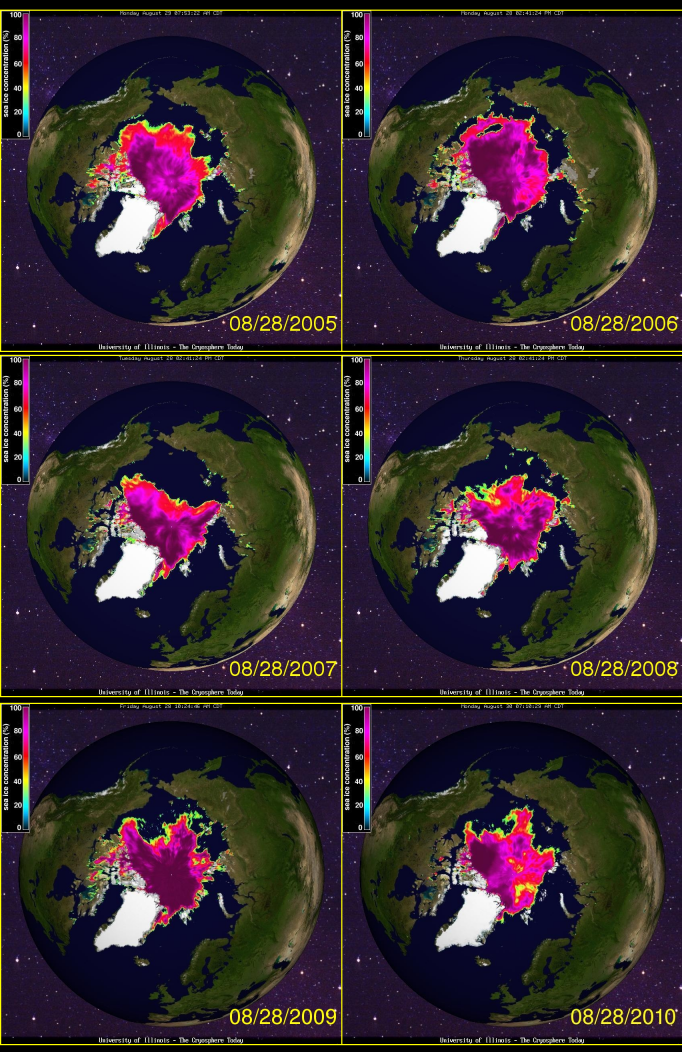
images source: http://arctic.atmos.uiuc.edu/cryosphere/
The lower volume of sea ice in 2010 should be very clear from these images. The suggestion of lower volume in the Cryosphere Today images is supported by PIOMAS volume data:
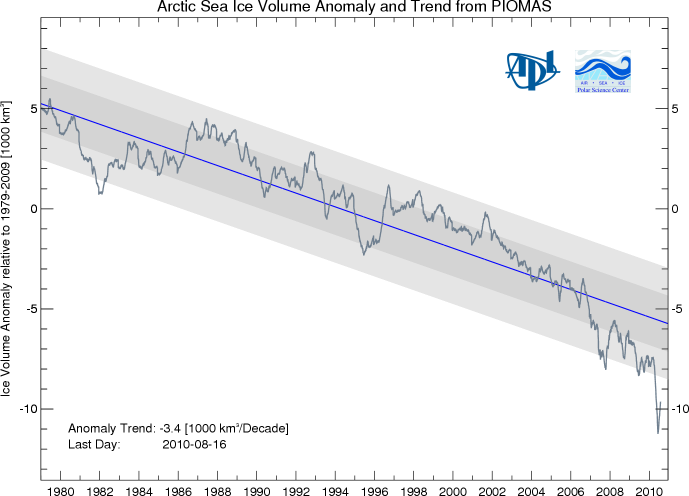
source: http://psc.apl.washington.edu/ArcticSeaiceVolume/IceVolume.php
Ice in the North West Passage and almost all of the passages amongst the islands of the Canadian Archipelago melted away this summer, but a great amount was replaced by streams of ice from the main Arctic pack. The ice in the main pack spread out to make up the loss. The overall effect of this is that the loss of ice in those passages has not registered in extent figures.
Why Arctic recovery is highly improbable
Any news or blog report which suggests that the Arctic is recovering should be treated with great caution. Ice extent in the Arctic - both on land and on sea - has been declining since about 1850. The decline is obvious when old maps showing ice caps and sea ice summer minimum extent are compared with current satellite images.
In the 1850s ships might just be able to cross Baffin Bay for a few weeks in late summer - by darting between massive floes to reach Lancaster Sound. In some years even that was impossible.
Until about 1900 ice extended along the east coast of Greenland down around Cape Farvel and up along a substantial part of the west coast. As I write these words, that coast is virtually ice free. An atlas published in 1993 and based on data accumulated from 1959 to 1983 shows how the Arctic used to melt and freeze until very recently. The Atlas of Canada 5th edition is a valuable free resource. The sections - such as the one used here on sea ice - can be viewed online or downloaded at very high resolution. The images below are reduced in size for the benefit of readers who may have slow web connections or low resolution screen settings.
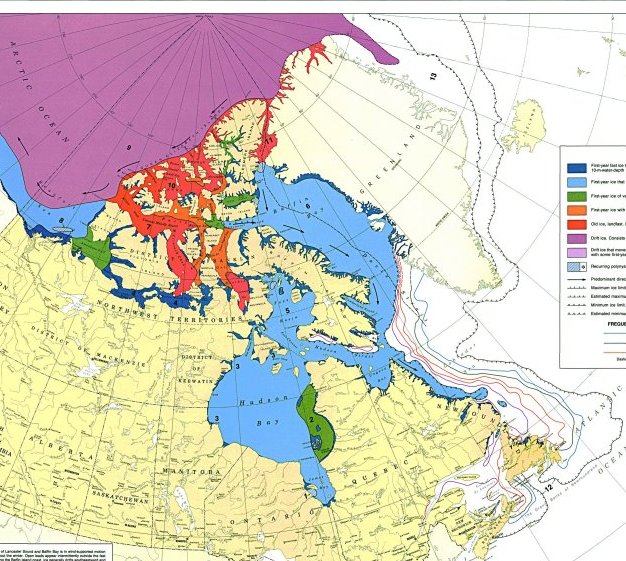
Late Winter sea ice extent.
The two dashed lines around the east coast of Greenland, outside the number 13, show the estimated maximum and minimum of sea ice extent. The sea ice here, even in 1993 when these maps were published, could still quite properly be called the Great Ice barrier.
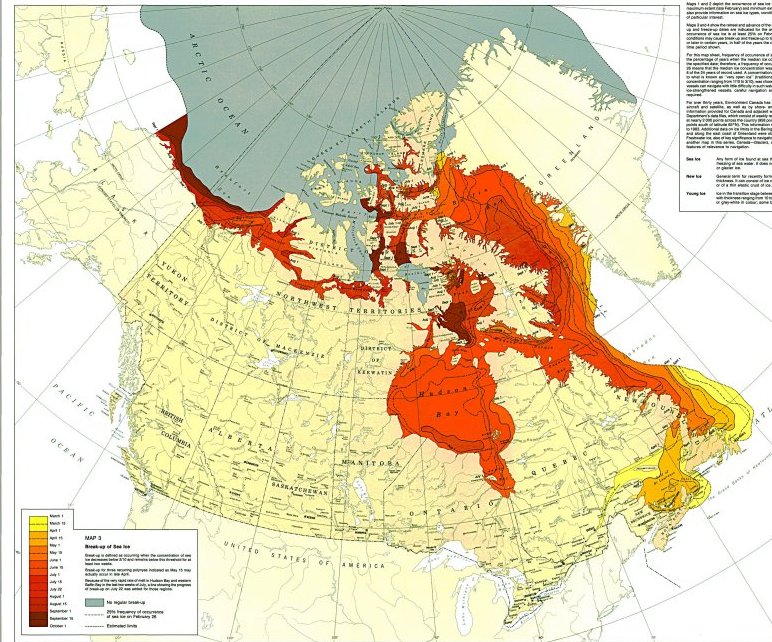
Breakup of sea ice.
The grey area shows sea ice which the compilers of the atlas considered to be not subject to regular breakup. The main ice cover used to consist of ice which could reasonably be considered as a single mass. Leads and polynyas would appear and disappear as the wind, blowing across thousands of kilometers of ice, built up forces which would open cracks and then close them. Ice forced into, onto and under other ice would build up great thicknesses of old ice. Some of that old ice would be exported through Fram Strait, but its volume was held in check by the former Great Ice Barrier and the Odden Ice Tongue. Each year, ice exported in summer was replaced by new ice in winter, on average.
From Nord to Svalbard the sea was formerly choked with ice. Old ice streamed south through Fram Strait on a regular basis. It appears to me that much of that ice melted as it traveled south along the edge of Greenland's former Great Ice Barrier, and in melting absorbed heat that would otherwise have eroded the Great Ice Barrier. With rising air and water temperatures this sacrificial ice would not - I suggest - have been enough to protect the Great Ice Barrier.
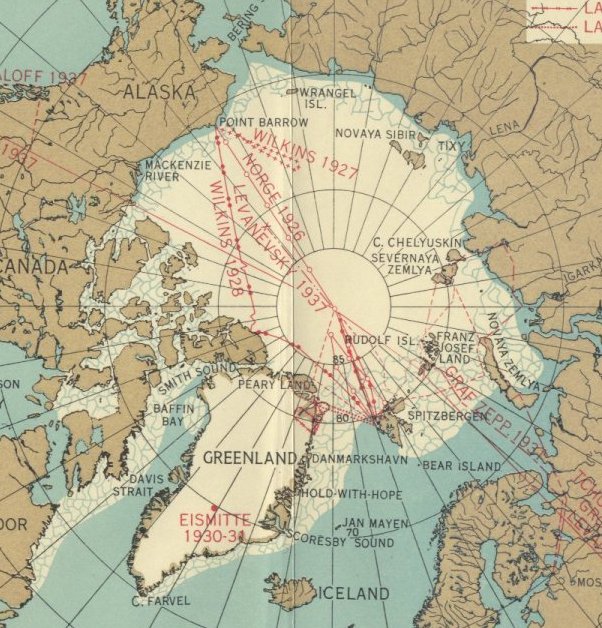
Minimum sea ice extent 1939
This map published in 1939 and compiled from data collected during the 1920s and 1930s shows the Great Ice Barrier extending down to the southern tip of Greenland. By 1993, when the Atlas of Canada 5th edition was published, the barrier had retreated north to Scoresby Sound.
Slowly, inexorably, the Great Ice Barrier has reduced in area until a tipping point was passed where it could no longer recover in winter from summer melt. Greenland's east coast, much of which was formerly unreachable by sea is now accessible by sea for much of the summer season.
As I write these words, the last landfast ice is breaking up along the northernmost part of the east coast of Greenland, as shown in this portion of the MODIS Arctic mosaic image for August 31 2010.
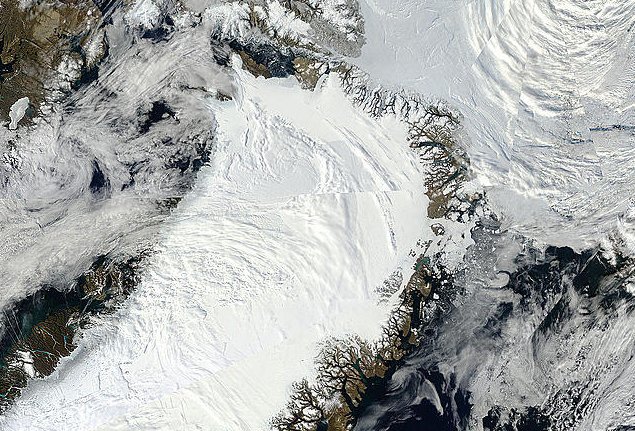
Greenland August 31 2010.
image source: http://rapidfire.sci.gsfc.nasa.gov/subsets/?mosaic=Arctic.2010243.terra.4km
Note that Nares Strait continues to export ice from Lincoln Sea; Kane Basin is dotted with icebergs from Humboldt Glacier; Baffin Bay is virtually ice free.
This year we have seen significant calvings of both branches of Jakobshavn Glacier. The calving of Petermann Ice Island, first reported here August 05 2010, produced - to the best of my knowledge - the greatest single calving of a Greenland glacier ever recorded. The last remnants of the Arctic's ice shelves - over 3,000 years old - continue to break up.
The remaining older ice is confined mainly to a roughly triangular area between the pole, McClure Strait and Fram Strait. Normal ice motion in the Beaufort Gyre and the Transpolar Drift may be expected to transport much of the remaining old ice away from that coastal area and substitute first year ice. Ice will most likely continue to be exported through Fram Strait during the winter.
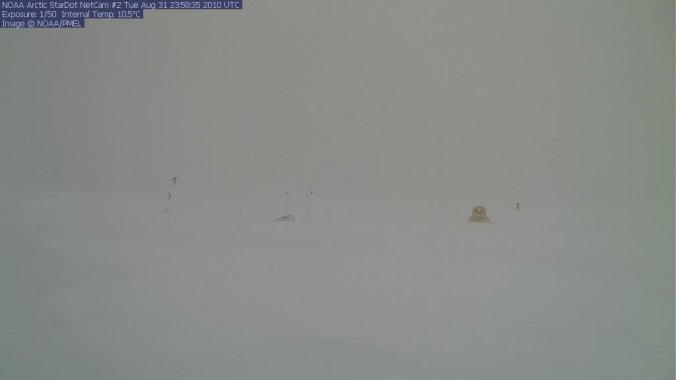
image: http://www.arctic.noaa.gov/gallery_np.html
Snow is now building on the ice, as shown by the North Pole camera. However, as noted below, this is not necessarily good news.
Prognosis
The trend towards an Arctic that is virtually ice free is inexorable. Apart from the generally cited albedo effects there are other major factors which need to be considered. Not only does the albedo of water substitute for the albedo of the ice which once covered the open water. There is a substitution of thermal capacity as well.
Formerly, the continuous sheets of ice of great thickness would radiate heat into space during winter until a great mass of ice was reduced to well below zero degrees C. In summer, that ice could absorb great amounts of heat before getting anywhere near its melting point. Even before that, the snows of winter would need to melt, meanwhile increasing the Arctic albedo.
The very thin ice we are seeing now is going to be affected differently by snow. A great thickness of snow piled onto a thin floe will overload it. The weight of snow can submerge the floe so as to immerse the whole surface of the ice in water. If the water is warm enough, the ice will melt and then the snow in turn will melt. On the other hand, if little snow falls so that the ice is not immersed then that snow will melt rapidly in the Spring, as will the ice beneath it.
Snow is a fairly good insulator. A layer of snow on ice will reduce the rate of radiative heat loss. If heat input from warm water is even marginally greater than heat loss to atmosphere then the ice will, I suggest, continue to melt until the water temperature drops to freezing point.
The thinner the ice, the further the waves can penetrate. Swell can penetrate even further. Waves and swell tend to fragment the ice, rather than compact it.
More open water means more opportunities for Ekman transport. This, together with the mixing promoted by wave action could interfere with the normal currents and circulations of the previously ice-covered ocean.
Any area of open water can freeze over in winter, adding to extent. The ice can continue to cover open water until the coast is reached, after which the ice can pile up if there is enough time before the thaw resumes. In fjords and channels, as the ice expands on freezing it can form ridges and thicken. Whatever the ultimate thickness of the ice which forms in the winter of 2010 - 2011 it will be predominantly first year ice. First year ice loses salt and gains strength with each passing year. But, I suggest, most of the new ice which forms this coming winter will not persist into a second winter.
But it isn't winter yet. Until the whole area within the Arctic Circle is in constant winter darkness we shall almost certainly see further ice losses.
Footnote:
Due to illness my rate of posting has dropped. Although I try to drop by to read comments I don't quite have the energy to deal with them just yet. But please do continue to leave comments - I value all input very highly. You don't even have to agree with my views. :-)
For quite frequent Arctic news, you may want to check out -
http://neven1.typepad.com/blog/


Comments