

So what - you might retort - these are still "unpublished", in the sense that they have not seen the light of printed matter on scientific publication; they still only exist in the form of preprints. Let me clear the ground from misunderstandings here: between December 13th and today the two collaborations have worked hard at polishing off their results and documenting them as well as possible. The results have not changed significantly, but this was not granted: it is what was meant by the word "preliminary" attached to every plot. Now, however, they are guaranteed to not change anymore.
Today is therefore a good time to give a look at the results once again. I will not discuss the results, but maybe just paste below the p-value distributions produced by the experiments. These, I believe, are the most informative graphs for those who believe that the Higgs boson does exist. So here we go, Atlas first,

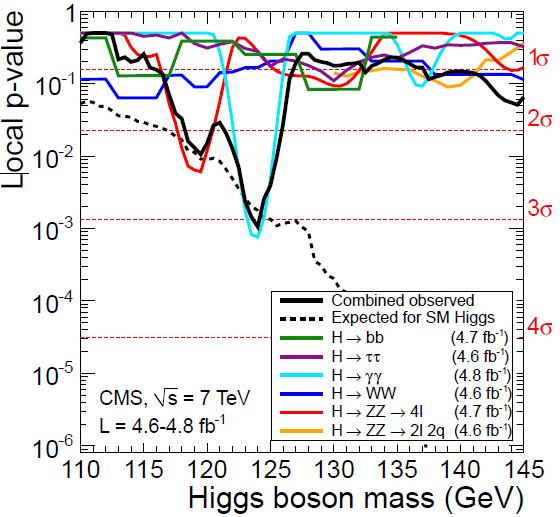
and CMS second,
A few remarks on these pics.
1) the expected p-value in case of a Higgs boson in the data, in the two graphs, is shown by black hatched lines. Please observe that at 125 GeV ATLAS expected to see a p-value of the background-only hypothesis equal to 0.005, or a bit less than three sigma; CMS expected to see a p-value of exactly three sigma, so CMS had in principle more power (due to using more final states in their searches, and slightly more statistics in some cases IIRC). The data, however, chose to fluctuate the other way: ATLAS has an observed p-value of about 0.0002, CMS "only" 0.001, for the (a posteriori) most probable Higgs mass hypothesis.
2) The various p-values for the individual searches are shown by different colored lines. The ATLAS plot has the expected p-value for each, while the CMS plot doesn't - a understandable choice given that CMS is displaying six independent analysis results against the three of ATLAS.
3) Don't be deceived by observing a "disagreement" between expected and observed p-values in the ATLAS plot (for the 125 GeV hypothesis). What is plot is the "median" expected p-value, but the statistical fluctuations intrinsic of the searches naturally allow that quantity to be observed at very different values. Plus, it's a semi-logarithmic plot!
4) I find the agreement of the two experimental searches impressive, and as I have already said here, I believe this is really the effect of Higgs boson decays in the ATLAS and CMS data we are looking at.
To summarize, the two figures do talk of something going on in the 120 GeV region. For a Higgs believer, in fact, one might argue that the Higgs boson mass has already been measured: a mass of about 121+-5 GeV results from an eyeballing of the 95% CL limits. But that is too large a leap of faith. Let us then just say that there is a fat chance that the Higgs boson has indeed a mass of about 124-126 GeV. That being true, the LHC this year will definitely allow CMS and ATLAS to conclusively observe it - 8 TeV running conditions have been confirmed last week at the Chamonix workshop, and 20 inverse femtobarns of proton-proton collisions are a fair estimate for the amount of data that will be delivered next year.
One word about the two publications: the documents are rather technical, so I do not advise newcomers to download them and try making sense of them. However, graduate students working in LHC experiments should, in my humble opinion, spend the better part of a weekend over them. I guarantee there is something to learn, and it is stuff that will be needed in order to really make sense of the next round of results! And don't be scared by the length of the papers upon downloading them: most of the pages just contains the authors names !!


Comments