

There is a wide variety of phenomena that could signal the production of black holes in the proton-proton collisions of the LHC. The one considered by the latest article by ATLAS is just one of them -the production of photon-jet pairs of high combined mass, which could result from the decay of a black hole that would not have time to thermalize. But in truth ATLAS does the opposite: they search for gamma-jet events of high mass, without specifically focusing on black holes. They thus produce aspecific limits on the rate of processes that would yield that signature, and that is, I think, a very good thing.
Indeed, exclusive searches for very specific final states predicted by particular new physics models are useful but a bit narrow-minded. With the large amount of data now available in ATLAS and CMS, and with the failure of fashionable models of new physics to provide predictions that stand the experimental test, it is quite reasonable to study the data in a more inclusive fashion, concentrating on rather generic signatures and determining if the corresponding data agree with the Standard Model background or if they depart from it.
ATLAS considered their while 8-TeV data sample and produced a spectrum of the invariant mass of energetic photons recoiling against a jet. The photon signature at high energy is quite clean, so backgrounds are mainly due to the compton-like scattering process of a quark-gluon collision yielding a quark and a photon; a second background is due to hadronic jets fragmenting in such a way that the leading particle is a photon. These are not "direct" photons, in the sense that they are not the direct result of the hard scattering process, but are secondary by-products of the final state partons.
Despite the above distinction, the analysis is performed in such a way that the background processes are estimated from the data themselves - a smooth distribution of invariant mass is their collective result, so one may search that smooth spectrum for a Gaussian bump signalling the presence of a resonance or other turn-on phenomena.
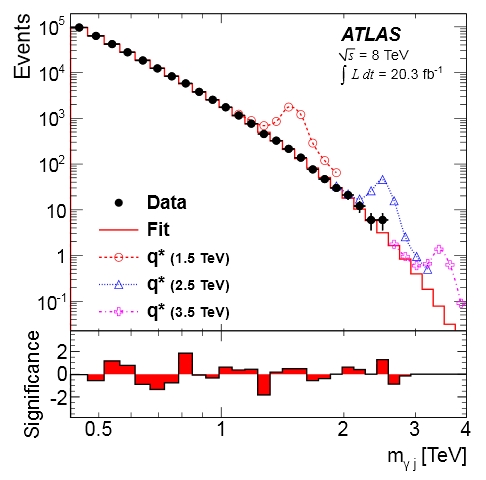 The mass spectrum obtained by ATLAS is shown on the right. As you can see, this is indeed quite smooth and well interpreted by the employed functional form. The presence of a resonance - such as could be an excited quark, q*, deexcitating to a quark by emitting electromagnetic radiation, or a quantum black hole or other fancy new things - would produce enhancements such as the ones shown by dashed histograms in the graph. Also note the lower portion of the graph, where ATLAS incorrectly labels the y axis as a "significance" (it is not, technically, but the discussion of why that is so is for elsewhere). The red bars still give a feeling of the compatibility of the data with the chosen parametrization, which would be otherwise hard to make out from the semi-logarithmic distribution on top, especially at the lowest mass end.
Using by now well-tested technology of limit setting with the CLs criterion, ATLAS proceeds to interpret the data in terms of an exclusion of the cross section for quantum black holes and excited quarks as a function of the mass scale of those processes (see e.g. the figure below). However, they also produce a limit for a generic narrow resonance as a function of its mass, so that a future model can compare to the ATLAS result without the need for a new analysis.
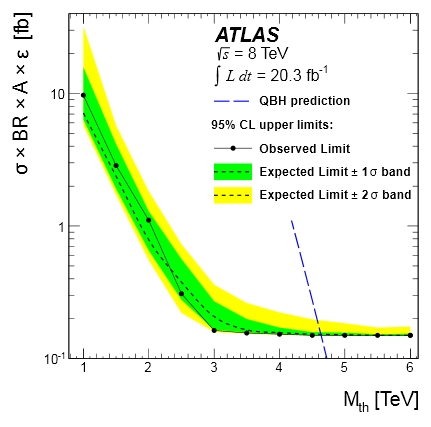 The graph on the left shows the usual "Brazil band" plot, where for any hypothetical quantum black hole treshold energy (for parameters n=6 and MD=Mth, but these are details which can only interest those who will read the paper anyway) the upper limit at 95% confidence level is drawn on the product of cross section times branching fraction to photon-jet pairs times acceptance. The black points show the result, while the band as usual describes the pre-data expectation for the limit, given data size, detector efficiency and analysis technique. The dashed blue line shows that models with a energy scale below 4.55 TeV are excluded in this particular scenario.
All in all a nice analysis, and I must say I wish I saw more of these signature-based searches. Specifically, I would like to see searches that consider the data even more inclusively, and multivariate techniques that take care of evidencing region of multi-dimensional parameter space of the observable quantities where the data disagree with background expectations. But such searches are still viewed with suspicion in the HEP community, partly because the mindset is still aligned with that of our now aging mentors, who learned how to hunt for new physics when computers still munched hole-punched data cards. Those new ideas will take time to win over the scientific consensus.


Comments