

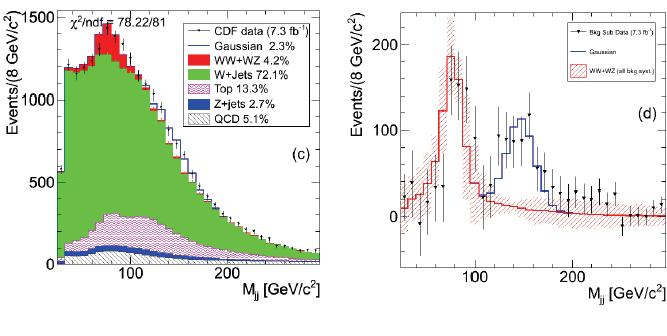
You need to have been sleeping for the last four months in order to have missed the news about the CDF signal (I don't even link my own posts on this except the last one -please dig in the last months of stuff if you feel the urge to). In a nutshell, however, what CDF sees is an enhancement in the invariant mass distribution of pairs of jets produced together with a leptonically-decaying W boson, produced in the 2-TeV proton-antiproton collisions at the Tevatron. This enhancement fits very well the hypothesis that the W boson be produced, with a cross section of about 4 picobarns, together with a 145-GeV resonance. CDF quotes a significance of over four standard deviations by analyzing a dataset corresponding to an integrated luminosity of 7.3 inverse femtobarns -all the W bosons plus jets they could collect from 500 trillion collisions. The signal can be seen in the background-subtracted figure shown on the right panel of the figure below: it is represented by the blue Gaussian function.
Now, it is a general rule of thumb that under normal circumstances two eyes must see the same thing if they belong to the same head. CDF and DZERO are expected to see things similarly, because the two detectors are not too different overall, in their sensitivity to high-energy processes at least. So if the CDF signal were true, DZERO should also see it.
Unfortunately, DZERO had better things to do than study W+dijet events in recent times, and their latest analysis looking for a diboson decay process in the mixed leptonic-hadronic final state (say, for instance, WW-> lv jj) had stopped looking after studying little more than one inverse femtobarn of data. They saw the dibosons, and started doing more important things. But then the CDF signal came, and DZERO found the time and energy to redo the analysis with four times more data.
The results are as follows: DZERO sees no enhancement in the 145-GeV region. They understand the distribution of invariant mass of jet pairs collected together with leptonically-decaying W bosons well as the simple sum of well-known Standard Model processes, and they need no Gaussian bump anywhere in the spectrum. You can see the dijet mass found by DZERO in the figure below.
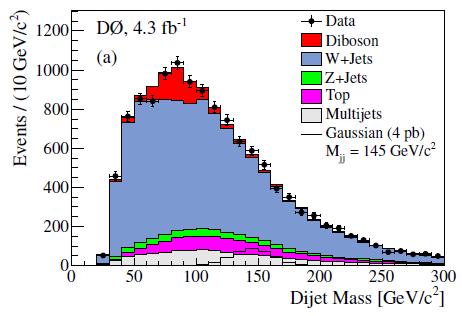
From the plot you may observe that the background composition of the Wjj data in the DZERO analysis is quite similar to the one predicted by CDF: this is not a surprise - once you select such a final state, most of the times you end up with W production together with two jets emitted by the initial state of the collision (the blue histogram); sometimes you have top pair decays where you miss one additional lepton or a few jets (the purple histogram); and a few other times you mistake the lepton-neutrino signal for a W when it is in fact just hadronic jet activity somehow misread by the detector (in grey). The red histogram instead is the first motivation of such searches -the diboson signal whereby one W decays into leptons and a further boson -W or Z- decays to a pair of jets, thus producing a bump in the 80-90 GeV ballpark.
As you note, the data follow very well the predicted background anywhere. There is no hint of a deviation, while if the CDF signal were present in DZERO data it would certainly show up. This is evidenced by the figure below, which shows a background-subtracted distribution (all backgrounds except the diboson WW/WZ processes have been subtracted from the observed experimental data, and this results in the black points with error bars). The background uncertainty is here plotted as a empty blue band sitting at zero, and the signal corresponding to the CDF observation is the hatched black histogram.

From the observed agreement of data and background, and from a calculation of the predicted lineshape of the invariant mass that a narrow resonant state would produce after detector reconstruction, DZERO proceeds to extract a limit in the cross section that the tentative new particle could have, given the observed data. This results in the figure shown below.
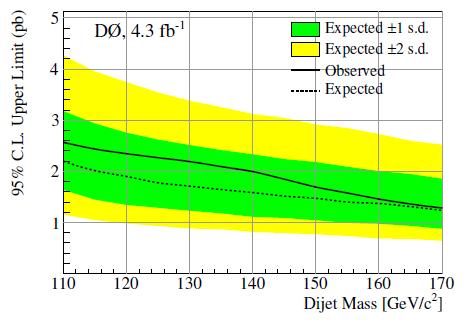
The black curve is the upper limit found by DZERO on the rate of production of a WX state decaying into W+dijets, as a function of the tentative mass of the X state. The hatched line shows the median expected limit -the median of upper limits that DZERO would expect to set, if the experiment were repeated many times with as many equal-sized, independent datasets all homogeneously collected in the same experimental conditions.
You can see that a 4-picobarn resonance would never have escaped the analysis: the limit is half that value, and the green and yellow bands show that only in very unlucky instances would DZERO fail to see it if it had a 3-picobarn cross section. However, much more interesting is the following figure, which is however a bit more complicated to explain. I'll do my best.
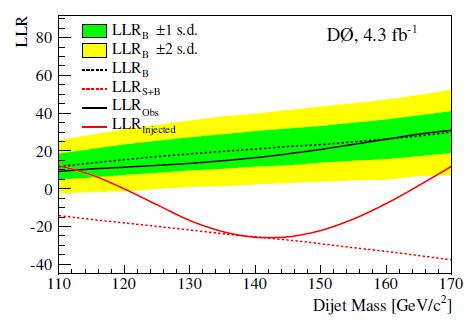
The vertical axis this time is not a physical quantity but just a statistical estimator, called "Log-Likelihood Ratio" (LLR). This is a number you can extract from the mass distributions by fitting either for background alone (hypothesis H_0, described by the black dashed line) or for background plus a Gaussian signal (the alternative H_1 hypothesis, described by the red dashed line). Due to the difference in the two hypotheses H_0 and H_1, the LLR statistic would be much different, and become increasingly so as the mass of the hypothetical X particle increases (you can understand this behaviour from the fact that backgrounds die out as the dijet mass increases, and thus a given signal would be easier to spot there).
The data have a LLR which follows closely the H_0 hypothesis -unsurprising, given the results of the previous figure. But this one figure does contain some additional information: it tells you just how significant would the H_1 hypothesis be, if it were true. Take the full red line, which represents the result that you would expect to get if a X particle of 4 picobarns did exist, with a mass of 145 GeV as found by CDF. You would find that the LLR would start to deviate from the H_0 prediction for mass hypotheses above 120 GeV, reach a maximum deviation at 145 GeV, and then return to conform to H_0 if the tentative mass were hypothesized to be too large to fit for the signal that a 4 picobarn, 145-GeV particle would yield.
In other words, the red line is what you should observe if the CDF data were produced by a new particle. Instead, DZERO observes the full black line, which lies at a LLR distance which corresponds to four standard deviations. One may thus conclude that the CDF signal is not observed in DZERO data, and that the latter disproves the former.
Now, this is all you need to know, but in truth, there is something more to say. Because the DZERO analysis does something differently from what CDF does. Otherwise, what should we conclude from the fact that the two datasets appear so horribly in disagreement ?
The devil, as they say, is in the details. But unfortunately, from the information available to me, I see no detail whatsoever that can make a real difference in the observed dijet mass spectra. DZERO does apply some corrections to the Monte Carlo simulations, to account for differences observed between simulation and real data in the reconstruction efficiency of leptons and jets. Other corrections applied to the MC, which are derived from data, are those that account for trigger effects. But I see no reweighting applied other than that, and so I must conclude that DZERO did their homework conscentiously and that the CDF analysis must have something weird going on somewhere.
Which is even more weird, if I think at it. The CDF analysis underwent a deep level of scrutiny; a group redid the full analysis from scratch after it was first presented; and the added data that CDF could throw in after the first observation of a 3.5 standard deviation effect (in 4.3/fb of data) has confirmed the effect, which is clearly of systematic nature. What is going on ?
I guess we might never really find out what is going on. If more time and effort is invested in this issue by CDF, by DZERO, and by the other experiments, we might end up understanding more about the structure of the bacgrkounds contributing to this data selection, and maybe also pinpoint some peculiarities of the jet energy measurement of CDF. But I venture to predict that the interest in this funny effect will slowly and steadily decrease. The final blow is probably going to be given in a few months, when ATLAS and CMS will present their own findings in statistics three times smaller than that of DZERO, but more sensitive due to the better quality of the newer detectors and to the higher cross section of W plus jets processes in the higher-energy LHC collisions.
What is sure is that I will let you know promptly about those searches, too. My interest is also economic: I have bet $200 that the CDF signal is not real, and I hope I will collect the cash by the end of the summer... (By the way: when I put the betting offer out I had no knowledge of the DZERO analysis result.)


Comments