

So it is better for us to return to our usual business: the exclusion of possible new physics models at the Large Hadron Collider. Mind you, we are not talking here of superluminal speeds or other quite fancy and unexpected things that nobody really believed could exist: before the LHC turned on, the majority of my colleagues were confident that the CMS and ATLAS detectors would see the first hints of Supersymmetric particle decays in the matter of weeks, or even days after the first collisions. In retrospect (if you did not do it years back already) one is bound to ask oneself: how gullible can a physicist be ?
SUSY is around the corner. But where is the corner ?
Indeed, physicists are usually optimistic in the predictions they make for future discoveries. And the field of high-energy collider physics is not an exception.
Because new physics must be there, see: the Standard Model cannot work by itself all the way to the Planck mass scale, and on the other hand there is a lot of stuff going on at the energy scale where electroweak unification occurs -the one corresponding to the mass of weak vector bosons. And that is the energy scale which we are currently in the position of testing with the LHC.
Given the above, it is both reasonable and convenient to believe that any new physics should make itself visible at the same mass scale at which it allegedly "mends" the shortcomings of the Standard Model . And SUSY, the theory that postulates the existence of a doubled set of particles and fields, is among the best candidates of new physics in the market.
But things are turning out differently. Rather than seeing spectacular new cascade decays of SUSY particles, we are amassing large amounts of data that follow diligently the Standard Model predictions. Depending on how you look at it, it is conforting or depressing.
Actually we understand our data so well, that in the tens of thousands of distributions we have checked in ATLAS and CMS while collecting the data, we have so far found only a handful of 3-sigma or 4-sigma bumps here and there. And these fluctuations invariably die off when more statistics becomes available.
I know, you'd die to see the bumps we bump into in our study of the data. Sorry - of course we cannot share that early and unmotivated excitement with outsiders. That would damage the perception of good science by the public, see. But okay, this is another topic than the one I wish to discuss here today.
The ATLAS analysis: jets and missing energy
So let us go back to the topic in the title. ATLAS published a few days ago a neat analysis of 1.35 inverse femtobarns of proton-proton collision data, equivalent to roughly a hundred trillion collisions. They selected events which contained six energetic hadronic jets plus a large amount of missing transverse energy: a signature which should be contributed by the decay of Supersymmetric particles, if those existed and had a mass small enough to be copiously produced.
I feel I am losing some of you already, so let me explain what is that signature in easy terms and why it could be the signal of Supersymmetry. What we call a hadronic jet is the result of the violent kicking off a proton of a quark or gluon. Quarks and gluons are the constituents of protons, but they cannot be pulled off as you would extract a raisin from a plum cake.
If you pulled a quark off, you would feel a force increasing with the distance you take it apart from the proton, until the energy you spend would turn into an additional quark-antiquark pair popped out of the vacuum: the antiquark would bind tightly with the quark you had in your hands, while the other quark would rush back inside the proton to balance the quantum numbers of the latter. You would end up with a meson (a quark-antiquark bound state) in your hands, not a single free quark. If you then pulled the quark and antiquark in the meson apart, you would cause the popping out of the vacuum of another quark-antiquark pair: your efforts (and energy spent) would thus create two new mesons, but again, no free quarks.
The phenomenon above, repeated multiple times, is responsible for the so-called "hadronization", and occurs when a violent collision pushes with high energy a quark off a proton. The end result is the creation of a spray of light hadrons, which collectively retains the energy and direction of the original quark. As I anticipated, we call such things hadronic jets: we measure their kinematics in the calorimeter systems as if they were a single "physics object". They are not; yet the simplification is quite useful.
Typically, a proton-proton collision creates a pair of jets emitted transversally in opposite direction if seen from the angle of view of the incoming protons. But often more jets are created. This occurs when the two original quarks radiate off gluons before hadronizing: gluon radiation is not too different from electromagnetic radiation off a moving electric charge.
And what about missing transverse energy ? I must have explained it a hundred times in this blog, but there's always new readers to care for, so here goes. Missing transverse energy is the signal that one or more particles are flying out of the collision point unseen by the detector. These particles are usually neutrinos, but if SUSY were real they might also be fancier bodies called "neutralinos".
Neutralinos are not the superpartners of neutrinos, but that is a detail and I prefer to avoid discussing it now. The lightest neutralinos in the particle spectrum are similar in their behavior to neutrinos, in that they do not interact with the matter in the detector, so they escape unseen. Now, what happens when a particle escapes unseen ? It happens that the rest of the particles produced in the interaction appear to "recoil" against nothing. A neutralino goes to the right and you do not see it; other particles you see all go to the left, and you wonder what the heck is going on. It is just as if you sent a billiard ball against another one head-on, and observed the pair moving both toward the left after the collision. Conservation of momentum forbids that! In the case of particles something unseen must have flown the other direction.
So, jets and missing energy. I have not explained to you just why a neutralino would arise preferentially together with many hadronic jets in a LHC proton-proton collision. This occurs because what would be produced first would be a pair of squarks or a pair of gluinos, the superpartners of quarks and gluons. Squarks and gluinos feel the strong force and are therefore produced copiously if they exist and are not too massive. They then decay into other lighter supersymmetric particles, emitting ordinary quarks or gluons as they do.
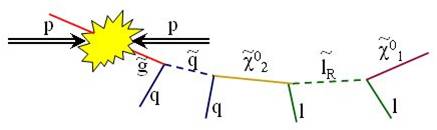
The total process ends up with the two lightest supersymmetric particles, the neutralinos, plus (in most cases) a large number of hadronic jets. There is the signature sought by ATLAS. A cartoon picturing a typical chain of decays is shown above: a proton-proton collision creates a pair of gluinos (red); one of them is followed to show its decay to a quark-squark pair, and the subsequent decay of the squark in a quark plus second-generation neutralino, then the latter decays into a lepton-slepton pair, and finally one gets the lightest neutralino and a further lepton. Note that the leptons present here are not searched for by the ATLAS analysis, which retains a inclusive nature (and has higher efficiency than more exclusive searches).
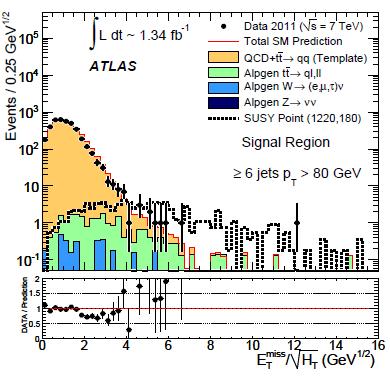 So what did ATLAS see ? Their results can be summarized in the sample figure on the right, which I took from the paper. The data (black points) lines up very well with the sum of expected backgrounds in a histogram of the observed missing transverse energy (here normalized by the square root of the total visible energy, but please ignore the detail). Supersymmetric particles would produce a enhancement at high values of missing transverse energy, as shown by the dashed histogram.
From the data plot to the exclusion plot
The agreement of data with Standard Model processes allows ATLAS to place stringent new limits on the production cross section of superparticles. These cross section limits are then compared to the predicted value of the new physics model, determining if the data exclude it or not. To explain how this is done, let me make an example.
Say that for a certain set of unknown Susy parameters (gluino mass of 500 GeV, etcetera) the theory predicted a cross section of 100 femtobarns for the searched signal: This means that in a 1.4 inverse femtobarn dataset a total of 140 signal events should have been produced -that's right, since to get the number of events you just multiply cross section and luminosity.
Now, let us assume you have made a tight event selection which, according to your simulation, should accept one every 10 signal events (but rejects backgrounds 999 times out of 1000, so that it is a sound thing to do). When you fit your data, the fit returns a probability density function (PDF) for the number of signal events N which is peaked at zero, and has a tail dying off quickly as N exceeds a few units.
Let us reflect on the meaning of this PDF. This is the result of your search. It tells you how likely it is that the data in your hands contains a certain number of signal events. To get your 95% confidence-level limit you now need to find the number of events N_95 which divides the probability density function in two parts, one on the left containing 95% of the area, and the other on the right containing only 5% of it.
If you find this N_95 equals 7, for instance, you can say that the search "excludes the presence of 7 or more signal events in the data" at 95% confidence level. This implies that a smaller signal is less incompatible with the data you got, while a larger signal is increasingly more unlikely. Also observe that 95% is a convention: even if a real signal were there, once in twenty cases your analysis would exclude that number.
Since the 140 events theoretically predicted multiplied by the 10 percent efficiency makes 14 predicted events in the final selection, your observation that N<7 allows you to say that the cross section must be smaller than half of the theory prediction. The ratio observed/predicted being smaller than unity in turn allows you to specifically claim that you have excluded the new physics model corresponding to the choice of parameters you made when you simulated your signal.
Since Supersymmetry is not a physics model but a infinite set of physics models, depending on the value of more than a hundred unknown parameters, you can then play the game of determining which parameter space points are excluded by your data. This requires you to redo some of the analysis steps: you change the gluino mass from 500 to 550 GeV and re-run your simulation, recompute the signal cross section, determine the new efficiency (it will be higher than 10%, in general, since the more massive your signal particles are, the easier it is for them to pass your kinematical cuts, which usually are of the form "energy above some threshold").
You can then redo your fits with a modified signal template, determine a new N_95, and compare with the theory prediction (which is of course different for a different set of parameters). Suppose N_95 is now 10, and the theory prediction is 8: the point is not excluded this time. Your data allowed you to excluded a gluino mass of 500 GeV, but cannot exclude 550 GeV.
Note that the above procedure is not immediate -it requires quite a bit of gymnastics. And since the SUSY parameter space has over 100 dimensions, it is utterly impossible to compare your data to all of these hypotheses one by one. What ATLAS does -in line with the other experiments- is to select a subset of the theories, which can be specified by the value of much fewer parameters. In the so-called "mSUGRA model", for instance, you need to specify no more than five of them. Further choose two among the most relevant ones -be it the mass of scalars and fermions at the grand-unification scale- and you can construct a two-dimensional plot, each point of which is a different theory.
Oh joy, finally you can display your complicated analysis results in a concise and tidy-looking form! You draw a line separating the parameter space points you have excluded and those you haven't, do the same thing for past experiments, and you are done -anybody looking at the graph will immediately visualize how much of the unknown territory you have managed to explore.
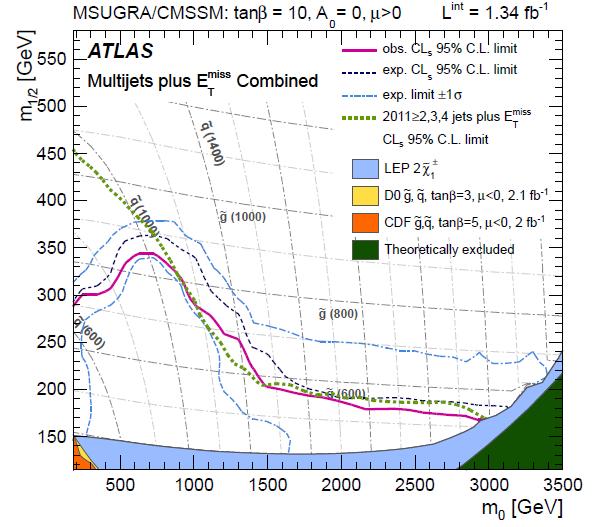 [A few notes on the graph: the two quantities on the axes are the universal masses of scalars (in the horizontal axis) and fermions (in the vertical axis). The filled areas contain parameter space points excluded by previous experiments; the black thin lines show the mass of gluinos and quarks that the parameter space points correspond to. The ATLAS exclusion region is the one to the left and below the thick purple curve. In green is shown the result of another ATLAS search, which considered events with smaller jet multiplicities, again containing large missing Et.]
Expected versus observed limits
One further detail is missing, however. What are those dashed blue lines bracketing the observed limit in the parameter space ? They are concisely labeled "+-1 sigma expected limit", but what does that really mean ?
Those lines answer a different question than the most poignant one of "what parameter space points did you exclude with your search". The question they address is "given your super-duper detector, your fantastic data, and your cunning analysis, how far were you expecting to exclude in the parameter space, in the absence of SUSY ?". To answer this you need to go back to your computer, and sit through long sessions of so-called "pseudoexperiments generation".
A pseudoexperiment consists in the generation of false data sampled randomly from the background processes alone. The size of data should be the same of the actual dataset you collected (what a statistician would call "conditioning"), but details may vary. Once you have the "toy" data, you pass it through your analysis chain and determine a new exclusion set -a set of parameter space points you would exclude if that toy data were the real thing.
If you repeat the generation of pseudoexperiments a large number of times, you can then associate to each parameter space point a probability that it would have been excluded, computed as a simple ratio of successes over trials. You finally draw lines passing through the points excluded at least 84% of the times, 50% of the times, and only 16% of the times. Those are the dashed curves in the figure.
A comparison of the actual exclusion curve with those "plus-or-minus-one-sigma expected" does not make you terribly more intelligent: it only reveals how lucky you've been in your exclusion game. If your curve stays on the side of the "minus-one-sigma", you have been unlucky -your data is a bit more signal-like than the Standard Model simulation predicted it to be, and you cannot exclude as much of the parameter space as you might have for data following precisely the SM prediction. This, incidentally, might also arise if the data did contain a SUSY signal, one to which you were not sensitive enough to detect. On the other hand, if your limit extends past the average expected one, your data "underfluctuated", i.e. they are even less signal-like than backgrounds alone, allowing you to set tighter limits.
Summing up
To conclude, I apologize for this long post to the very few of you who got reading this far down. I hope I have clarified a little the cuisine behind these exclusion graphs, which are so common in nowadays particle physics. Of course: we cannot find signals, and yet we need to publish papers!
So we publish exclusion plots, and pretend it's all what matters. And since there is no real boundary in the parameter space of SUSY, every time we extend our investigation we are free to change the axis boundaries to higher gluino-squark masses, showing that there remains a large swath of parameter space still to be explored...


Comments