

The talks on Higgs searches are scheduled for this morning at the Moriond Electroweak conference in La Thuile, a nice ski resort in the Italian alps.
The money plot is the one below, which shows the upper limit on the Higgs boson production rate, in units of the Standard Model expectation (y=1 on the vertical axis corresponds to the SM Higgs production rate, for the particular mass identified by the abscissa in the graph).

The Tevatron experiments can exclude Higgs masses above 147 GeV at 95 % confidence level, a region which has already been wiped out last year by the data resulting from more powerful collisions analyzed by the LHC experiments. However, what is most important in the graph is that the black curve describing the observed 95% exclusion "departs" from the dashed curve at the center of the "brazil flag" band, for Higgs masses in the whereabouts of 125 GeV. The upward departure signifies that the experiments predicted they would see fewer Higgs-like events in that region from background sources alone.
The experiments quantify the "significance" of the discrepancy as a 2.2 standard deviations effect: way too little to discover a new particle, but yet enough to convince many of us that the signals observed by ATLAS and CMS in the corresponding searches are probably due to the real thing. As a reminder, the two LHC experiments found upward fluctuations in their searches which amount to discrepancies of 3.5 and 3 standard deviations from the background-only hypothesis, if the Higgs boson mass is assumed to have a mass in the whereabouts of 125 GeV).
In the end it is just a matter of what your prior beliefs are. 3-sigma, 4-sigma, 5-sigma... Let's not get obsessed by these figures. Above 3 standard deviations a pure statistical fluctuation is already very, very unusual (save the infamous "look-elsewhere effect", of course); but systematic effects may make even "one-in-a-billion" fluctuations become commonplace. And since systematic uncertainties not accounted for by the experiments can and do occur, as the recent saga of superluminal neutrino measurements clarify, one needs to compare one's personal belief about the likelihood of the claim with the actually observed result. The 6-sigma evidence of superluminal motion of neutrinos found by Opera last fall was obviously not enough for scientists to get convinced of the breaking of the theory of relativity; a genuine 4-sigma Higgs signal is all it takes to convince me.
To put the above another way: "extraordinary claims require extraordinary evidence". Well, the existence of a 125 GeV Higgs is not at all extraordinary to me: I would rather say it is a rather expected thing, given the mass of evidence on the correctness of the Standard Model and the indirect information on the possible range of masses of the Higgs that the Standard Model itself provides.
I was surprisingly attacked by prof. Matt Strassler three months ago for saying that the LHC results on the Higgs were "firm evidence" for the existence of the Higgs boson. Now these 2.2 additional standard deviations -a one-in-fifty effect- do not allow me to change that objective, scientific evaluation: firm evidence was (technically, a above-three-sigma effect), and firm evidence remains. But the independent find by the Tevatron colleagues does raise the odds to which I am willing to bet that the Higgs boson is indeed there.
UPDATE: Now I can offer much more information on the Tevatron searches. I decided I would simply add it here rather than in an independent posting. So let us examine the material in more detail.
First of all, one should ask oneself whether the Tevatron experiments are capable of observing signals known to exist: the Z->bb decay in WZ and ZZ production events is a very good test of the power of the searches for the corresponding WH and ZH (with H->bb) production processes: WZ and ZZ have cross sections over ten times larger than WH and ZH, but the H->bb decay is more frequent than the Z->bb one by a factor of 5. So if the experiments can demonstrate that they see the Z->bb signal in WZ and ZZ events, one can then trust the Higgs results much more.
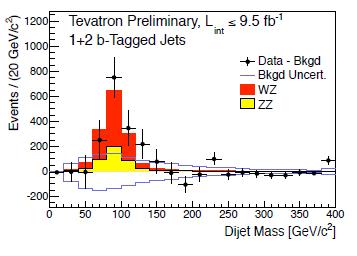 The proof is given by the figure on the right, which shows a background-subtracted mass distribution for pairs of b-quark jet candidates (both single and double b-tagged events are used here) associated to a leptonically-decaying W or Z boson. The blue histogram shows the background uncertainty, the red and yellow histograms describe the expected WZ and ZZ signals, and the black points are experimental data (after background subtraction). One clearly observes an excess in the Z mass region -and some additional excess at higher mass.
 Next, let us look at a very interesting figure which shows the data presented as a function of the "signal purity". In other words, data from different searches is classified according to the expected value of signal to noise corresponding to their characteristics. The bins with higher relative signal content are the rightmost ones (technically, the abscissa has the logarithm of the signal-to-noise). Here, the hypothesis is made that the Higgs boson has a mass of 125 GeV. Expected backgrounds are collectively displayed in blue, and the expected SM signal contribution is in red. The data, shown by black points with stat-only error bars, nicely agree with the sum of the two processes, hinting at the fact that some Higgs events might indeed be present. Of course we are talking about a very small signal, and the data are not incompatible with backgrounds alone in this particular view; but the figure is still important to examine.
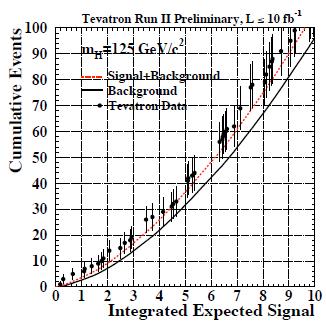 A histogram closely connected to the one above is the one showing the number of events observed and expected for the two hypotheses (background-only, in black, and background-plus-signal, dashed red) as one sums bin contents in the histogram above starting from the right, and continuing leftward. In other words, the figure shows a cumulative distribution considering the bins ordered by signal to noise. Because of the ordering, the leftmost part of the integrated distribution allows one to see the signal contribution more clearly, while once data with larger relative background content is added as one move toward the right, the signal becomes less and less important in a relative sense. As you can see, the data points consistently follow the signal-plus-background hypothesis (actually overshooting it). This imples that there is a signal-like component in the data. However, do not be deceived by the error bars of the data points: they are 100% correlated, because of the way the histogram is constructed. That means that to visually size up the discrepancy of data with background alone one can only count the distance of the data points from the black curve once, in all the graph. That means a roughly 2-sigma discrepancy, similarly to what I announced at the beginning of the article.
 Now let us go to the background p-value. This is a number which quantifies how likely it is that the data comes from background sources alone. Since we are making multiple hypotheses for the Higgs boson mass in the analysis, and each mass point is independently studied and optimized, one ends up with a different p-value for each different Higgs mass hypothesis. Do not get confused: we are still discussing the background-only hypothesis, but the data changes along the abscissa, which should thus rather be labeled "Higgs mass hypothesized in the corresponding data selection and analysis", if one wanted to be clear. Anyway, the black curve shows the observed data p-value; the dashed curve shows what p-value one would expect to observe (technically, this is the median value of a possible distirbution of p-values) if the Higgs boson did exist with the mass corresponding to the abscissa value. We also get to see a band of expectations, indicating that for 125 GeV the observed p-value is perfectly in line with what one would expect if the Higgs were indeed there with that mass.
 A different view of the same information is provided in another "brazil band" graph which I actually prefer to the one above: this is a plot of the logarithm of the likelihood-ratio discriminant between the two different hypotheses of background-only and background-plus-signal. By taking into account the two hypotheses together, one can plot also the background-only expected p-value here (in black, dashed, with brazil-band surrounding it), while the signal-plus-background hypothesis is this time in red. This way, one can verify how well the data matches with background-only predictions for Higgs mass values away from the 125 GeV point that we are all convinced by now is close to the true value. See below.
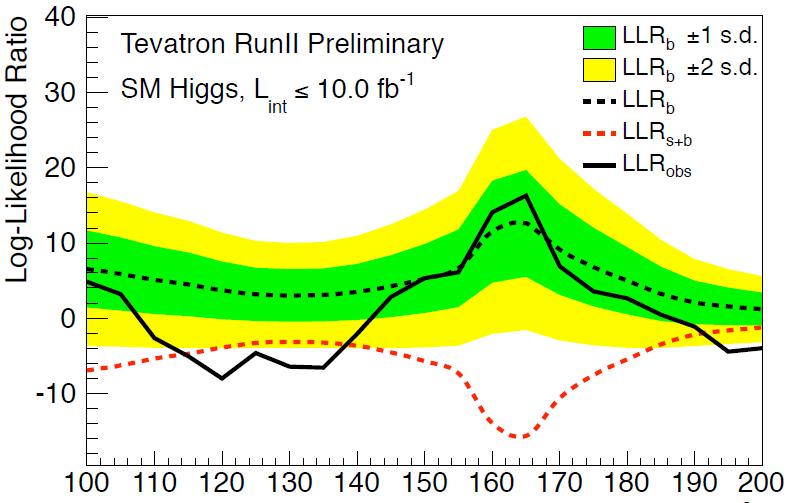
From the figure it is clear that there is a departure from the background-only expectation only for Higgs masses in the 115-135 GeV region. The agreement of full and dashed black curves in the rest of the spectrum is instead reassuring that background expectations are in line with observed event counts.
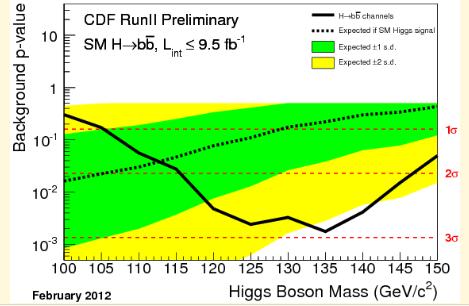 At this point one might well wonder which, among the various decay modes that have been investigated by the CDF and DZERO collaborations before putting together the information in the above graphs, is the one contributing the most to the observed signal-like excess. Of course such a question can only be answered meaningfully by providing a plethora of different results in the independent channels. However, there is a shortcut, provided by the figure on the left. This shows the p-value of the background-only hypothesis as a function of the Higgs mass hypothesized by the different data selections and analysis. The figure only receives as input the CDF searches for H->bb decay modes: that is all WH and ZH production processes yielding the H->bb decay together with a leptonic W or Z boson signature. The latter may result in charged leptons and missing energy, charged lepton pairs, or even just missing energy, when the Z decays to neutrino pairs. Anyway, the figure shows that the H->bb signature of CDF is alone producing an almost 3-standard-deviation effect at 125 GeV. This is the single most significant observation among the various Tevatron channels.
Having seen the above figure, one might wonder whether the combined Tevatron result is not just due to a bad underestimate of backgrounds producing b-tagged jets in W/Z +jets samples. This would be a rather nasty attitude, however: I recall the figure I pasted above, where the WZ and ZZ signals demonstrate that CDF and DZERO appear capable of precisely estimate backgrounds in the search of such signals. However, it is true that the excess is mostly coming from the bb final state. The global picture from CDF can however be appreciated by another graph, which changes view from the "null hypothesis" perspective to the one of fitting the possible Higgs signal in the data. By taking all the search channels together, CDF produces a global fit for the signal strenght assuming that the branching fractions in the individual channels are the ones predicted by the Standard Model. The result is the one below.

You can see that for a Higgs mass hypothesis of 125 GeV the CDF data is in line with expectations (which correspond to the value of 1 of the vertical scale, i.e. the Standard Model prediction). This is another nice way to look at the CDF results. I unfortunately do not yet have available a corresponding graph for the DZERO searches, but will try to paste it here later today.
More information is coming as I collect it from today's La Thuile talks... Stay tuned!


Comments