


How can we predict the climate so far ahead when we can't do an accurate weather forecast even ten days ahead? Well it is remarkable that we can forecast our weather even one day ahead, and by looking at how the forecasters do that we can begin to understand how the models can work over longer timescales. When I was a child in the UK in the 1960s, with our unpredictable weather, a cautious person would take rain gear with them almost no matter what the forecasters said. Even as late as 1987 we had Michael Fish's famous weather blooper. This broadcast is so famous here that it starred in the Olympics 2012 opening ceremony.
"Earlier on today apparently a woman rang the BBC and said she'd heard there was a hurricane on the way. Well if you are watching, don't worry, there isn't. But having said that, actually, the weather will become very windy, but most of the strong winds incidentally will be down over Spain and across into France."
His full weather forecast broadcast is here.
For more on this see this interview with Michael Fish: "Great Storm of 1987: Michael Fish's 'white lie'". The white lie there is that actually nobody rang in to the studio, to say that they had heard there was a hurricane on its way. He just said it as an embellishment to enliven his forecast.
He was on the early shift when he said that. Later on the same day, we had one of the largest storms we've had in the UK in recent times, the UK's "Great Storm of 1987". There were wind speeds of up to 115 mph, many trees blown over and 18 people died. They'd got the strong winds right in the forecast but they thought the worst of the weather would hit Spain, and instead it hit England.
And here he is correcting it 25 years later :)
So, how can that happen, and can it be fixed? By answering this we begin to get an insight into how the longer range predictions work over years and decades as well.
I will look at this first, how they predict the weather one day ahead. Then I'll take a historical perspective on how they came to be confident in the longer range forecasts decades into the future, indeed they make predictions tens of thousands of years into the future too. Many of the questions raised by climate skeptics were major issues for climate modelers in the 1950s through to the 1980s. It may be interesting to read how they eventually found a way through them. Before one can begin to criticize what they say in an informed way, one needs to understand why they are now far more confident in their models for long term climate change prediction than they could be even as recently as the 1980s.
(This article is a little long - about 60 printed pages probably. I plan to make it into a kindle booklet and an online booklet with table of contents and will add a link here once it is ready. I feel that it is a subject that needs a careful and detailed treatment.)
Add table of contents to this page (on my website) - blog post on Science 2.0 without the TOCHow they predict the weather one day ahead
First you might think the way to do it is to constantly improve the resolution of the models and accuracy of your data. Eventually maybe you can simulate individual clouds right down to this level of detail:
Here is an example of a much more complex high resolution simulation running for the weather over Germany with many different cloud types at once.
If you could do that, and it was accurate, then you'd be able to predict every single cloud and you could do predictions as accurate as this scene from "Back to the future II"
Doc: First you've got to get out and change clothes
Marty: Right now, it's pouring rain!
Doc: Wait five more seconds
Right on the Tick. Amazing, absolutely amazing. Too bad the post office isn't as efficient as the weather service.
It's not clear how he knows this (in that fictional world). It could be from previous visits to that time, but the newspaper cover later in the movie shows that they are able to predict weather to the minute at least
There's discussion amongst the fans about how it works in that fictional alternative present - whether it is through accurate weather prediction, or perhaps most likely, it could be through weather modification. See also fan discussion here.

At any rate it's clear we aren't in that future yet. Could that ever happen in reality? Could we predict the weather accurately to the minute? And if not, how can they predict the weather at all?
To answer this let's look at the history of climate models. Many of the issues the climate skeptics raise today were asked by the original modelers in the 50s through to the 80s. By looking at the many discoveries they made along the way we can begin to understand how they gradually developed confidence in their models.
Surprising discoveries about weather prediction
Originally in the 50s and 60s, weather forecasters thought we would be able to predict the weather as accurately as we liked, just by getting more data, more accurate data, and using very precise models. But then when they tried to follow through that program, they found that it didn't work. The detailed history of what happened is quite complex, see Chaos in the Atmosphere for details. But in summary they found that the weather would often change quite unpredictably no matter how carefully they modeled it. One of the early surprises came in the 1950s when Fermi used an early computer MANIAC at Los Alamos to study what would happen to a system of imperfect springs coupled together (not perfectly elastic) a bit like a sprung mattress. The physicists were sure that the system would eventually stabilize and that is what happened.

“Some of the 2500 tubes used in MANIAC, the Laboratory’s first electronic computer (1952–1957)." photo from Los Alamos shared on Flickr by Marcin Wichary - larger view here
This was the first computer to turn up some of the unpredictability you get from running computer models for a long time.
But one time they decided to run the program for a bit longer than usual and they were surprised to find that they system moved out of its steady state and started fluctuating wildly again. It would go steady for a fair while, then start fluctuating, move to another state, stay there for a while and then fluctuate again.
That was just the first hint that something strange was going on. Later on they got much more of a wake up call with Lorenz's discovery.
Lorenz wrote a program consisting of just three equations to simulate a simple form of "weather". It just modeled convection cells in a uniform layer with different temperatures above and below - a bit like heating a thin layer of water in a saucepan.
The same phenomenon happens in many different situations - in a saucepan, on the sun, in the Earth's mantel. Here is a demonstration of it in a saucepan (used as an example for solar convection).
Rayleigh–Bénard convection cells - these can be modeled by Lorenz's equations
You could hardly imagine a simpler system to model to make a start on weather prediction. Lorenz wrote his program to output just three numbers to describe the state of the complete system at each moment of time.
X = Intensity of convection motion
Y = Difference in temperature between ascending and descending currents
Z = how much temperature varies vertically
He then plotted those three points on a diagram. This video shows his model in action and shows how the fluid flow (at the top) relates to the position of the point in the Lorenz diagram (at the bottom).
To find out about it, see The Lorenz attractor and how it describes flow patterns in a layer of water with videos. And for more maths details see the Wikipedia page and the Wolfram maths page.
The next step was a matter of serendipity - random good fortune. His computer printed out only the first three digits of the six digit numbers to save paper. So he tried putting the numbers for the start of the simulation back in and running the program again, expecting to get the same results as before, pretty much. He was astonished to find that this new run produced completely different results. It turned out that changing just the fourth or fifth or even the sixth digit of the data would lead to completely different outcomes a short while later. Although he could hardly have guessed the far reaching implications of his discovery, this was the first ever inkling anyone had of what is now known as "Mathematical chaos" - the sensitive dependence of a system on initial conditions.
This video shows the result of running the simulation forward with two almost identical points shown in red.
Animation from Wikimedia commons by MicoFilós
The two red dots start off with the same values almost exactly, yet quickly diverge to rapidly different paths. This is known as a "bifurcation". If you start with almost identical points like that, sometimes they will depart from each other almost straight away and sometimes they may stay together for a long time, but eventually they will go their different directions.
The average time the system can run before it bifurcates like that is known as the Lyapanov time. For weather systems then that time period is about 30 days. The weather could bifurcate right away or maybe not for a long time, but on average then it will become impossible to predict exactly after around a month or two.
For more about chaos theory, this is a good intro
And this explains how you can do weather forecasts and also do climate change predictions even though it is a chaotic system.
Dr. Gavin A. Schmidt, Director of the NASA Goddard Institute for Space Studies. You get large local temperature changes year on year. Climate change is about a rapid change in the averaged temperature over a decade or so. Yearly changes can be due to the temperature redistributed around the world, or into the sea water and out of it again and things like that. There are many things that influence our global temperatures too. The variation in heat output the teh sun (very slight) the effect of volcanic eruiptions, the changes due to precession of earth's axis, of the changing orbit of Earth under influence of other planets, etc - the Milankovitch cycles.
You need to subtract all those. And then you see that the CO2 effect explains the remaining changes. There is a good explanation of this 31 minutes into this video
Coping with chaos
The result is that you can't predict the weather exactly over long time periods. But we know how to work with chaos theory. Example, there is a lot of chaos in our solar system.

Saturn's moon Hyperion rotates chaotically. If you have a spacecraft doing a flyby of Hyperion, you can't predict which face you will see. It becomes unpredictable over a timescale of 30 days or so. Yet its orbit is easily predictable, only its rotation is not. It would be easy to do a close flyby to within a few tens of kilometers. But you just wouldn't know which face you will see.
In the same way - you can predict many things about our climate on long time scales. You can predict trivially that the winters will be colder, the summers hotter. Here on the Isle of Mull you can predict that the end of the autumn, through to winter, especially late November onwards, is the season of storms. You can also predict that particular months have most sunshine and also be the driest month of the year and so on.
So, chaos in this mathematical sense is something we can deal with so long as our computers are fast enough. Early computers were so slow you barely had chance to do one run before you had to make a forecast. But nowadays we can do lots of runs, each with slightly different data. Then if there is a bifurcation, then some of the runs will go one way and some the other way. If you do a hundred runs and get rain for thirty of them and dry weather for seventy, then you can say that there's a 30% chance of rain tomorrow.
If that was the only issue, then there wouldn't be much anyone could say to challenge the climate models, not if they understood how they worked. However that's not the only problem
Problems of data and resolution
The main reason they missed the storm in 1987 was because of lack of data. Due to financial cutbacks they no longer had the weather ship Romeo in the Bay of Biscay which is where the storm started. They didn't have the modern weather buoys and their satellite data was also insufficient. No matter how many runs you do, your model can't be accurate if there are significant gaps in the data.
Even with enough data, the models then were coarse in spatial resolution. This became a major issue with the Lothar and Marin storms in 1999. This time the storm was predicted, but the severity of the winds was not. Even two hours before it hit Paris the inland speed were still predicted to be 90 - 130 km/h (56 - 81 mph). The winds actually experienced were 125 - 175 km/h (80 - 110 mph) and brought down 300 high voltage transmission pylons, and left 3.4 million without electricity. The highest speed gusts reached 75 meters per second, or 270 km / h (168 mph), the highest wind speeds ever recorded in Europe (see page 20 here). That was recorded on the Hohentwiel mountain in Southern Germany.
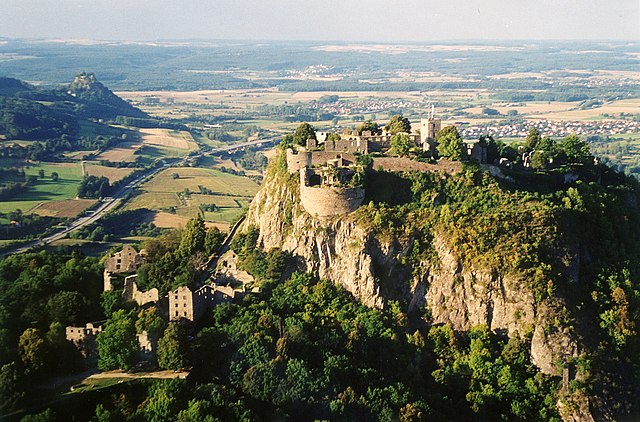
Ruins of Hohentwiel castle photographed from a small plane, credit Peter Stein. This mountain recorded wind speeds in 1999 of 270 km / h (168 mph). The models at the time didn't have sufficient resolution to predict such high speeds, and were not able to take account of details of the topography.
The problem this time was the low resolution of the model. In order to predict the winds correctly they needed to take account of the detailed topography. A later analysis in 2011 came to the conclusion that even a model with a resolution of 16 km, which they didn't have back then, was not sufficient to predict the high winds. Only the highest resolution model they had then, at 2.5 km resolution predicted them correctly. Neither model was available in 1999.
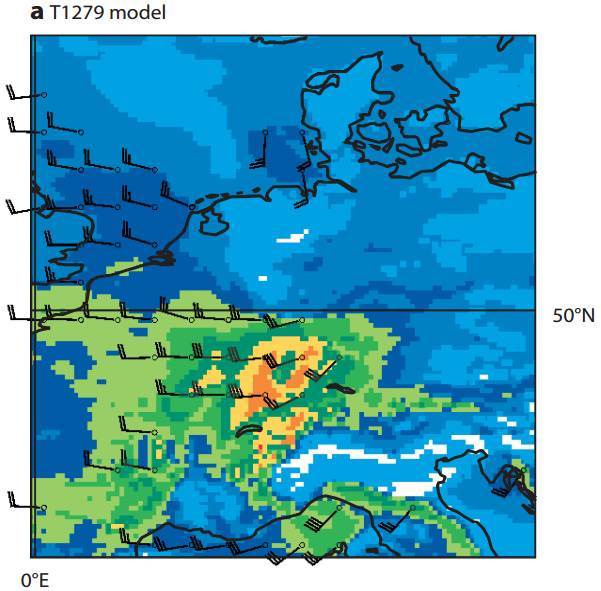
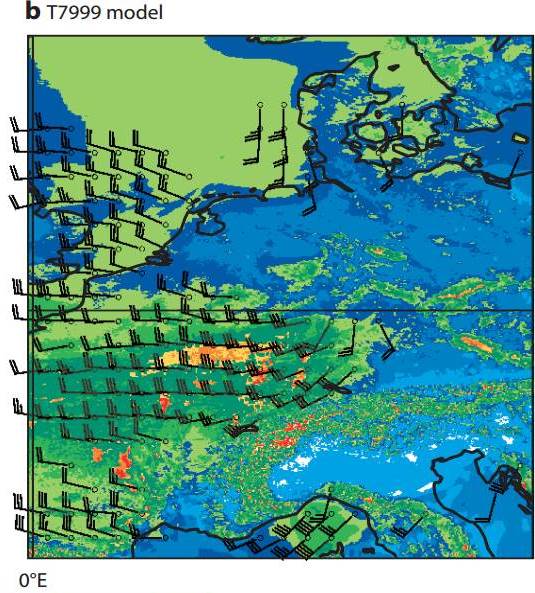
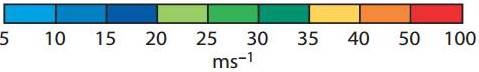
The first map shows the forecast for the 16 km resolution model. The highest winds are over 40 m/sec or 144 km/h. The second map shows the forecast of the 2.7 km resolution model. There are many spots with speeds greater than 50 m/s (180 km/h). Neither model was available in 1999. This shows that they simply didn't have the models available back in 1999 to predict the intensity of the winds.
So we have several types of sources of error in climate forecasts. We have the chaos theory bifurcations. This can be dealt with by doing many runs of the same model with different starting conditions. Then we have the systemic errors due for instance to insufficient data, or insufficient resolution. You can also get systemic errors because you leave out important factors in the process of making the model. It's impossible to model all the factors that can influence our climate. So which factors are the important ones? What if you have left something out.
Climate change random walks - 1970s
This is one of the first ideas the climate modelers came up with. What if the climate just randomly wobbles a bit warmer then a bit colder? And maybe if it shifts a bit warmer by chance, then it has more of a tendency to keep going that way? Then the entire process of moving in and out of the ice ages could be a result of random processes. This is one such paper from 1976. This is a later paper from 1990 though by then most climatoligists had moved on to new ideas . Some climate skeptics today say they think climate is just following some kind of a random walk. Well back in the 1970s they would have had good company from many of the climate modelers of their time
One of the best examples of a random walk is "Brownian motion". In this example then the fat globules in milk are being continually buffeted by the molecules of the milk around them. This causes them to jiggle around. Sometimes you may see some of the fat globules moving consistently in one direction for a while, but it is just random and they might well come back again.
So the idea was that the climate of the Earth itself was just moving randomly like that. We can predict it short term they thought, but it gets chaotic beyond a few days - and then beyond that, it is just not possible to predict the climate very exactly. Sometimes it gets a bit warmer, sometimes a bit colder, and if it keeps randomly getting colder for long enough we hit an ice age.
The last three interglacials all lasted for about ten thousand years. So, though we couldn't predict when it could happen and our weather could head towards an ice age at any time, they thought that it would happen at the same time again. Our current Holocene interglacial started 11,700 years ago. So based on that simple argument, it would seem that we are due for another ice age just about now. However far from it, the Earth is warming up.
What does it mean to say the world is warming up?
The climate is very variable on a year to year level. But if you average it over five years then you can see how it is changing. This plot shows the five year averages from 1880 to 2015. Notice that the Earth changes temperature most in the Arctic region, and that there are a few spots in the middle of the oceans which have changed only by a fraction of a degree. These are actual measured temperatures, not a simulation.
Five-Year Global Temperature Anomalies from 1880 to 2014
Correlation with the Milankovitch cycles
The first hint of the idea that we might be able to do long range climate forecasts (though not exact weather forecasts) came with the theory of the Milankovitch cycles - the idea that changes in the direction the Earth's axis tilts, over very long periods of time, coupled with other effects, can cause ice ages.
The Earth is in a mildly elliptical orbit so is sometimes closer to the Sun and sometimes further away. At the moment the Earth is closest to the Sun in the first week of January. So the southern hemisphere is tilted towards the sun when Earth is closest to the Sun and the northern hemisphere is tilted away.
That makes the southern summers warmer, and winters colder than they would otherwise be. While in the northern hemisphere then summers are cooler and winters warmer than average. It's been like that for thousands of years. But eventually it will change, and the northern hemisphere will get the more extreme seasons again.
Shows how the position of the pole star varies over a long cycle. Image credit Tau olunga
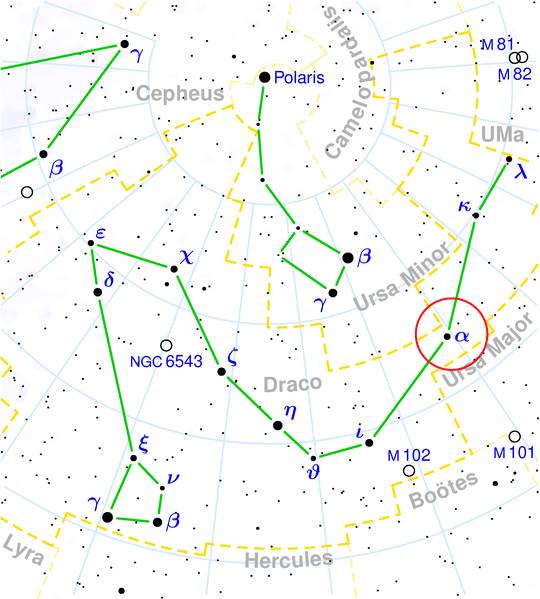
Thuban, shown on illustration of Draco Constellation by Torsten Bronger. This was the Egyptian pole star around 5,000 years ago.
So anyway - this obviously changes the seasonal temperatures in the two hemispheres. But when the southern hemisphere is warmer in summer, the northern hemisphere gets a colder summer, so averaged over the year the average temperature doesn't change. How can this cause ice ages? Also we don't get ice ages every 26,000 years. The pattern is far more complex than that.
Well first, there are many other things that change, though that's the most easily obvious of them.
This image from Windows to the Universe shows the three main ways the Earth changes
- Orbit gets more circular and then more eccentric, in two cycles which combine together, every 96,000 and 413,000 years
- Earth's axis precesses, cycle 26,000 years - this is why the southern hemisphere is pointed towards the sun when we are closest to it. This is a very slow change. But noticeable. At the time of the Ancient Greeks, 1000 BC. the Southern Cross was visible from Athens. And as I said above, the Egyptian pole star was Thuban.
- The orbit also slowly precesses, cycle of 112,000 years, not shown here. This combined with the axial precession means that it takes between 20,800 and 29,000 years for the closest point to the sun to return to the same date in the year, with an average period of 23,000 years, not 26,000 years as you might expect.
- Earth's axial tilt varies slightly, cycle of 41,000 years.
After the axial precession, the main effect there is the way the orbit gets more circular or more eccentric. At present the Earth's orbit is quite close to circular. That makes this a time of stability according to his theory, because when the orbit is close to circular the other effects on the climate are much less. There's not much that can affect it at all as the Earth is at much the same distance from the Sun in the summer, winter, and all the year round, in both hemispheres. For instance it's no longer likely that we are going to head for an ice age, or have any other dramatic change in climate, in the ordinary course of events.
Also when our orbit is more eccentric then the Earth spends a little less time closer to the Sun because it travels faster when closer to the Sun. These eccentricity changes are the only ones to actually change the total amount of sunlight the Earth gets per year, but they do so only by tiny amounts.
Anyway Milankovitch worked out the total amount of sunlight received at various latitudes. This can vary. For instance at present we get rather less sunlight over the year in the northern latitudes - our summer sun is not quite so bright as it would be because it is further from the sun in summer, and in winter when it gets less sunlight, it is closer to the sun but the higher latitudes have much of the day in darkness. Above the Arctic circle this effect is even more pronounced of course as there you get a dimmer sun in summer, and no sun at all in winter.
So anyway he then found out that the ice ages end at times when we get particularly high levels of sunlight at northerly latitudes.
This is a modern diagram from the NOAA. The warmer interglacials are shown in yellow. The graph at the top in red shows how warm it is in July at 65 degrees North, the modern version of Milankovitch's curve.This theory was first put forward by Milankovitch. Here he is as a student with a pocket watch.
There's a strong cycle there every 23,000 years due to the precession of the Earth's axis. Interglacials like the one we are in now happen when the weather is warmer in the northern hemisphere, though not every time. As you see, it has happened every five cycles for the last fifteen cycles.
The bottom line in blue shows the CO2 concentration in the atmosphere which is nowadays thought to play an important role in the warming, though Milankovitch didn't realize that. (Calculated from bubbles of atmosphere in the Dome Fuji ice core)
The middle line shows the temperature in Antarctica (calculated from hydrogen isotope ratios in the Dome Fuji ice core). The temperature in Antarctica is higher at times when the northern hemisphere gets most sunlight, even though at those times Antarctica gets least sunlight, because of global warming.
Milankovitch as a student, Vienna, late nineteenth century

This though was not very convincing right away. It is easy to prove the craziest things using graphs and correlations.
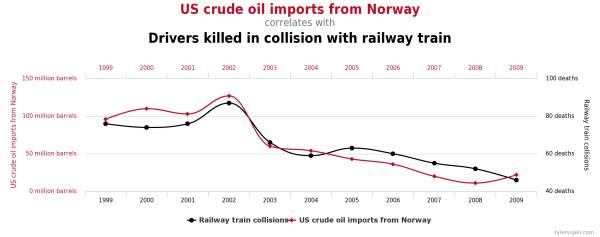
Correlations of railway train collisions with US crude oil imports from Norway - from spurious correlations
At best a correlation like that might lead you to consider a hypothesis to investigate further.
Is it a real effect or is it just a coincidence like that? The scientists needed to find out more to check this out.
So, brief history first, his paper on the subject is from 1920. Mathematical Theory of Heat Phenomena Produced by Solar Radiation included modern climate of Mars, Venus. The climatologist Koppen noticed the paper and noticed that some of the significant heat anomalies there matched in timing with the ends of ice ages. The ideas got developed through to his book in 1941. But after that it fell into disrepute. Didn't seem to explain things so well, and his curves didn't match in detail.
But later going on into the 1970s then after more research, more accurate measurements of past temperatures and so on, his theory started to pass all the tests instead of failing them. Then scientists began to sit up and pay attention to it again. Brief history here as powerpoint slides. They still had the puzzle, that the temperature changes seemed far too small to affect the climate so strongly, especially since the temperature averaged out over the entire year would hardly change.
There are two main ideas about how that can happen, or can be a combination of the two. Milankovitch's original idea was that when the upper latitudes get warmer, then ice melts in the summer, this exposes rock. Ice reflects away more heat than rock, and so cools down the Earth. So with the higher latitudes warmer, there is less ice, warms up the Earth, and that leads to less ice in a feedback cycle.

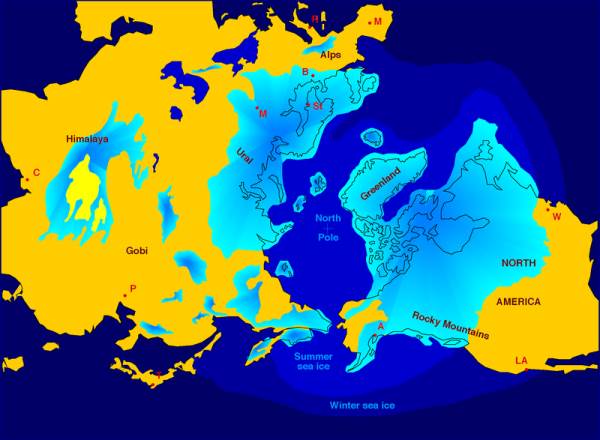
Left shows the extent of permanent ice sheets during an ice age, and right shows them today - just covering Greenland. When the ice sheets are smaller, then less heat gets reflected away so the Earth is a bit warmer. Left shows the Earth 18,000 years ago, and right shows it at present, image credit: Mark McCaffrey NGDC/NOAA
The other main effect is that when the Earth is warmer then the oceans can't absorb so much carbon dioxide, which then increases the amount in the atmosphere, which warms the Earth up further and so on.
However from the most recent research, it now seems that of those two, it's the CO2 release that triggers the warming at the end of an ice age, though it's the ice sheets that vanish first. At the end of an ice age, first the ice sheets disappear, but the world stays at much the same temperature as before. It continues like this for a lag of eight centuries, before the carbon dioxide levels and the temperature of the Earth rise together. This shows that it is the CO2 rather than the albedo change that contributes mainly to the warming at the end of an ice age.Both of these would be minor effects on their own. Though carbon dioxide is a greenhouse gas, it's not a very powerful one, not compared to methane. But any slight warming of the Earth gets amplified by the effects of water vapour. Where carbon dioxide scores over water vapour is that when you add a pulse of carbon dioxide, it's a rather one way process, far easier to add than to remove. It stays a long time in the atmosphere. While with water vapour, you can only add so much to the climate at any particular temperature. It will just rain out, within days, if you add more water vapour than the atmosphere of the world as a whole can hold at that temperature and will do that very quickly. So you can't warm the planet up by adding more and more water vapour to the atmosphere. But you can do it by adding more and more carbon dioxide.
Importance of water vapour to amplify effect of the CO2
This study from 2010 showed in a simple way that water vapour is an important part of the global greenhouse effect. This is an interesting study where the authors ran a climate model, first without the water vapour, then without the CO2.
They showed that the carbon dioxide accounts for about 20% of the greenhouse effect water vapour and clouds, 75% and minor gases and aerosols, 5%.
Without CO2, all the oceans would be frozen over
However the water vapour can't warm the Earth by itself. To test this, they took the model, in steady state representing today's atmosphere, and removed all the non condensing greenhouse gases and aerosols, and then ran it forward in time, the greenhouse effect collapsed as the water vapour precipitated out. Earth became a snowball Earth.
It ended up with an average surface temperature of -25 °C, after around 20 years of removing all the CO2 from the atmosphere from a starting point of a pre-industrial world with average surface temperature of around 4 °C.

More details here: CO2: The Thermostat that Controls Earth's Temperature, by Andrew Lacis
So the CO2 by itself would not be enough to keep Earth as warm as it does. It needs the water vapour as well. The water vapour amplifies the effect of the CO2.
Surprisingly small amount of warming to get from ice age to present - temperature changes more at the poles
Also bear in mind that though we are making only small differences to the concentrations of CO2 in the atmosphere, it doesn't have to be a huge effect. The difference in warming between the depth of the ice ages when glaciers covered New York and the warmest interglacial periods, is only 5 °C (or 9 °F). In that context, you can see that an extra warming of 2 °C is quite significant even though it seems a small temperature change. A small change in the average temperature of the whole Earth can lead to large local differences in temperature. It is rather a similar situation with sea level rises, see later.
ICE SHEETS of up to 3 -4 km thick covered large areas of western Europe and North America, and also the Alps and the Himalayas during the last ice age. The world was only 5 °C colder on average than it is today. But the higher latitudes are more strongly affected. Think what a difference it will make if the world becomes 4 °C hotter than it is today, nearly as much difference as there was between the last ice age and today!
Proxies - how they know the climate of the world in the past
You might wonder how they can know what the temperature of the world was tens and hundreds of thousands of years ago. This is the subject of Paleoclimatology, the study of past climates. They can't time warp a thermometer in the past, but they use various "proxies" that act like thermometers. See Paleoclimatology: How Can We Infer Past Climates?
- Ice cores. The ratio of hydrogen isotopes in the ice tells you what the past temperature was. Gas bubbles trapped in the ice shows the levels of gases such as CO2 in the past. We are lucky enough to have long ice cores in both hemispheres, from the Greenland ice sheet and the Antarctic ice sheet. This gives information about conditions in polar regions.
- Remains of forams and diatons, miniature shelled creatures in the sea. They can use the oxygen isotope ratios in their shells to work out the temperature of the oceans. Foram shells are made of calcium carbonate (like chalk and sea shells) and diaton shells are made of silicon dioxide (like sand).
- There are more of the forams and diatons when the conditions are warmer.
- The species mix of creatures in the sediments can tell you about conditions, as each species has its own ideal growing conditions so you can tell things about the climate by noticing which is the dominant species.
There are other many other proxies used over shorter timescales such as tree rings.
CO2 lags
A recent detailed analysis of the warming after the last ice age reveals this pattern of events 20,000 years ago. There are many details to be worked out, but this is a rough picture of what happens:
- The Milankovitch cycles trigger warming of the Arctic region which leads to melting of the northern ice sheets
- This reduces the strength of the Gulf Stream - or more generally, the Atlantic Meridional Overturning Circulation (AMOC) which consists of warm water moving north on the surface of the Atlantic and cool water moving south.
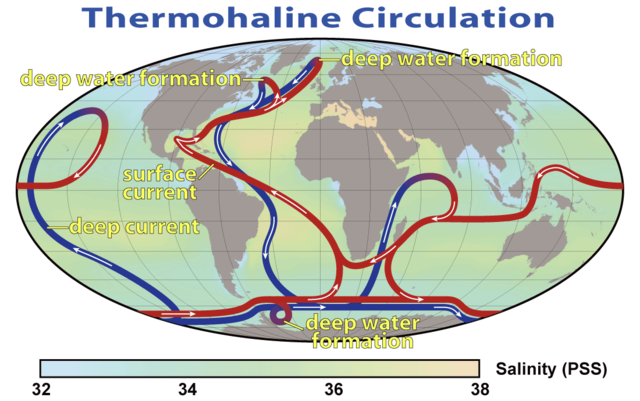
Complex movement of sea through the oceans. The red currents are warm, in this diagram and near the surface, the blue ones are cold and well below the surface of the oceans. As the Earth warms up after an ice age, ice sheets in the northern hemisphere melt, and all that melt water disrupts the circulation of cold and warm water between the hemispheres. This warms up the southern ocean. So far this has done nothing to change the Earth's average temperature, just changed the distribution of warm water around, but this leads to the southern ocean releasing or not absorbing CO2, which then, reinforced by water vapour, warms up the Earth as a whole.
- As it reduces in intensity, the southern ocean gets warmer. There is a seesaw of heat between the two hemispheres, which warms up the Southern Ocean at the same time cooling the Northern oceans. But the Southern Ocean warms up more than than the northern ocean cools, perhaps partly because of fresh water and also water vapour acting as a greenhouse gas
- This is also synchronized with a CO2 pulse.
- There are various ideas about how that CO2 pulse is triggered (reduction in rate at which algae remove CO2 from the atmosphere, less sea ice, warmer water)
- Strong Antarctic warming and increase in CO2 then follow in a feedback cycle with water vapour from the warming oceans amplifying the effect of the CO2.
So there was a small increase in temperature first, then that lead to CO2 release which then lead to more warming, which then lead to more CO2 and so on. In the most recent glaciation at least, the global temperature lags behind the CO2, only the Antarctic temperature precedes / correlates with it.

Graph from CO2 lags temperature - what does it mean?
The CO2 concentration (yellow dots) sometimes lags a short way behind the Anatarctic temperature (red).
But the average global temperature of Earth (blue) lags 800 years behind the CO2 concentration rise.A small increase in sunlight in the northern hemisphere leads indirectly to warming of the Southern ocean and Antarctica, and almost simultaneously to an increase in CO2 in the atmosphere. It also reduces the albedo in the northern hemisphere immediately but this has no obvious effect on the global temperature. Instead it seems from both observations and modeling that it's the CO2 that is the key factor in the start of the interglacials, with a lag before the full effect is felt.
They found that 93% of the temperature increase lags the CO2 increase. For details see Shakun et al. Clarify the CO2-Temperature Lag
You might wonder why this doesn't trigger a runaway warming. Well as the Earth gets warmer, then there's an increase in how much infrared Earth emits depending on its temperature. That is a cooling effect, and it kicks into place slowly at first, but the amount of heat radiated increases exponentially, so as Earth gets hotter, eventually this increase in infrared radiation slows down and then stops the warming. (See end of this New Scientist article)
For more scientific detail on the occasional CO2 lag after temperature rises, see the New Scientist article Climate myths: Ice cores show CO2 increases lag behind temperature rises, disproving the link to global warming And for the paper in detail, Global warming preceded by increasing carbon dioxide concentrations during the last deglaciation
Can the models work for the present day situation?
At present the increasing levels of CO2 are the result of humans burning fossil fuels and so on rather than due to movements of ocean currents. As we add more CO2, the world warms up, and this does make the Earth's systems less able to take up CO2 just as for interglacial warmings. However, because the atmosphere already has more CO2 than it would normally, there is no feedback from the oceans amplifying the levels of CO2. Indeed, as soon as we stop putting CO2 into the atmosphere it will start to be removed. Instead the warming effect on the oceans means that it takes longer for excess CO2 to be removed from the atmosphere than you'd expect.
Very long term effects of CO2
The average lifetime of a CO2 molecule is around 4 years in the atmosphere. But that’s for the more rapid processes such as plant growth, and absorption in the surface water of the ocean. Much of that gets circulated back into the atmosphere again. The slower cycle of removal of CO2 from the atmosphere is complex because of the way the Earth is less able to absorb CO2 the more you add, and behaves in surprising ways.
For instance after adding a pulse of CO2 to the atmosphere, half is removed in 50 years. You might think, half would be removed again in the next 50 years, but no, it takes 250 years to get down to a quarter of the original concentration. Finally, around 15 percent of the original pulse remains in the atmosphere pretty much permanently, for thousands of years. CLIMATE CHANGE - the IPCC scientific assessment
So of the roughly 32 billion tons of CO2 humans added to the atmosphere in 2010
- 16 billion tons will still be there 50 years later, in 2060,
- 8 billion tons will still be there 250 years later in 2260
- 4.8 billion tons will still be there indefinitely, for thousands of years.
From the Climate Change 2014 Synthesis Report Summary for Policymakers
So you have to be careful how you do the calculations.
That’s why it is important not just to stop the increase in CO2 emissions, but to dramatically reduce emissions if we want to stay within 2 °C rise by 2100, and even more so to stay within 1.5 °C. If the climate modelers are right, we need to act quickly, before 2020. We are not going to hit 1.5 °C by 2020 if we continue business as usual. But if we continue to emit 32 gigatons of CO2 a year for four more years, we will have added enough of it to the atmosphere already so that in most scenarios we will no longer remain within the target of 1.5 °C by 2100.
Long term predictions
The climatologists have done several successful long range predictions already. The IPCC predicted our present level of global warming already in the 1980s. They also predicted the exact amount by which the eruption of Mount Pinatubo would cool down the climate and for how long. They have also predicted La Ninas six months before the event. And most impressive, as we've seen, they have done detailed modeling of the ice ages based on understanding the Milankovitch cycles.
So the climatologists know that their models work, that you can do long range predictions with climate models. The question is not so much whether you can do it, but rather - what can you predict and how? The climatologists believe that they have eliminated most of the systematic errors. How successful have they been for the future?
For the how, what they do is they run the model with many different slightly different starting conditions. Randomly vary the conditions, a bit hotter here, colder there, a bit more wind here, a bit more humidity etc on the day the run starts from. Vary and tweak those parameters. Then see what happens.
Because of the chaos inherent in climate then even a month or two after it starts, the different runs will predict different outcomes. Maybe one of the models has a severe hurricane in August, another run has it in September, another one doesn't have any severe hurricanes that year. But now you run it for many years, for a decade, say. If all of the models with extra CO2 have more of the severe hurricanes and fewer of the mild ones, then you have a lot of confidence that adding CO2 to the model leads to more severe hurricanes and fewer mild ones. They will also use different grid sizes, and add different factors to the model to see if they make any difference.
As well as that, there are teams of researchers which build their climate models from scratch, in the US, UK, Australia, Japan etc. These teams work through the problem independently without reference to each other with different assumptions, and write their own computer programs. If those all agree then they begin to have a lot of confidence. And of course they then validate these models using past data to predict the present.
Detailed predictions
This approach, using climate models, let's them predict the weather not just for the world as a whole, but for individual countries. If they have removed the systematic errors, there is no problem with doing detailed predictions from chaos theory. Maybe sometimes next year is hotter than usual and sometimes next year is colder than usual for instance, varying with each run of the model. But if the temperature is higher than usual averaged over five years in all the runs, that's a reasonable prediction for the future.
You can look up the predicted effects of climate change on your country, or for any other country that interests you. Once you do that you may understand why so many nations signed the Paris Climate Change agreement.
In the US the main changes projected include: (quoting from the US Environmental Protection Agency report Future of Climate Change) -
- “Summertime temperatures in the United States that ranked among the hottest 5% in 1950-1979 will occur at least 70% of the time by 2035-2064“
- “Northern areas are projected to become wetter, especially in the winter and spring. Southern areas, especially the Southwest, are projected to become drier“
- “Heavy precipitation events will likely be more frequent, even in areas where total precipitation is projected to decrease.“
- “Heavy downpours that currently occur about once every 20 years are projected to occur between twice and five times as frequently by 2100, depending on location“
- “The intensity of Atlantic hurricanes is likely to increase as the ocean warms.“
- “Cold-season storm tracks are expected to continue to shift northward. The strongest cold-season storms are projected to become stronger and more frequent“
- “Permafrost is expected to continue to thaw in northern latitudes, damaging buildings, infrastructure, and ecosystems in Alaska.“
There they aren't saying that every summer from 2035 onwards will be as hot as the hottest 5% in the US for the period 1950-1979. Maybe summer 2035 turns out to be unusually cold in some of the runs of the model. But when they do the models many times, then by 2035-2064 then more than two thirds of the summers are so hot that back in 1950-1979 only one summer in twenty was that hot.
So, if you get a cold summer, or a cold winter, or even a cold year, that doesn't mean the models are wrong. You need to take a longer term view than that.
You can also look up the effects for individual states, e.g. this climate change report for Nebraska
And this is the projection for New York city which experiences higher sea level rises than the global average:
- Projections for sea level rise in New York City are 11 to 21 inches by the 2050s, 18 to 39 inches by the 2080s, and the highest estimates (shown as + in the diagram above) could reach as high as 6 feet by 2100.
New York City Panel on Climate Change 2015 Report Executive Summary
Other projections include:
- “The frequency of heat waves is projected to triple by the 2080s, and extreme cold events are projected to decrease.
- “The frequency of extreme precipitation days is projected to increase, with approximately one and a half times more events per year possible by the 2080s compared to the current climate.”
Next ice age - postponed
Our climate is predictable over such long timescales that they can even calculate when the next ice age will be - with or without CO2 warming - different dates for the two cases - though over shorter timescales you of course still can't predict every heat wave and hurricane.
Usually an interglacial like ours lasts for only around 10,000 years. It's 11,500 years since the last ice age. The amount of sunshine we receive in the northerly 65 degrees latitude is close to its minimum for the Milankovitch cycles. That would normally mean that we would be headed for an ice age already. But we aren't. Why is that?
In a recent study the authors selected only the models that most accurately tracked the previous ice ages, and used that to study whether or not we are due to plunge into the next ice age. They found that if they ran the models with CO2 levels of 240 ppm, similar to the Halocene, then the next ice age would be as soon as 1500 years into the future.
But if they used the pre-industrial levels of CO2 of 280 ppm, then the next ice ages should be 50,000 and 90,000 years from now (with a possibility of a slowly approaching ice age 20,000 years from now). Just that extra 40 ppm made all the difference. They are unsure why we had more CO2 this time around. Perhaps human activity even in pre-industrial society was enough to raise the levels by 40 ppm, which isn't very much, or at least contributed to the levels.
They found that with 500 Gt of emissions, not far off what we have already reached, we may already have enough CO2 in the atmosphere to make a difference to the ice sheets over thousands of years. If it reaches 1000 GT then the chance of an ice age in the next 100,000 years is notably reduced and with 1500 GT of emissions then it is very unlikely that we get an ice age in the next 100,000 years. And with higher levels of emissions, then we will end the pattern of ice ages altogether. You can read it in full under Nature's sharing initiative if you click on the link " published in the journal Nature" in the article in the Guardian here: Fossil fuel burning 'postponing next ice age
Now, it's not so bad at all to have prevented the next ice age. The climate is much more stable during the interglacials, while during ice ages then you can get dramatic changes of climate within decades. Also the Earth is more habitable for us during the interglacials. The question is really, what happens next if we continue in the direction we've been going.
Changes in the Arctic first - most affected by the global warming
So what's going to happen next to the global temperature with "business as usual"? The polar regions are most affected by global warming in the climate models, but particularly the Arctic. The huge ice sheet over Antarctica helps to stabilize temperatures in the southern hemisphere. So, the most dramatic changes are expected in the Arctic first, and this is indeed what has happened:
Disappearing Arctic sea ice
Right now as of writing this, it is 20 °C (36 °F) warmer than usual.For the last four years the ice cover in the Arctic has been well below the average values for 1981 - 2010 every single year. And not just that, it's been warmer than the average throughout the year as well, every single year since 2012.

Figure from Arctic Sea Ice News.
And this shows projections for the whole world.
"In the Intergovernmental Panel on Climate Change’s 5th Assessment report, scientists outlined four emission scenarios that serve as ballparks for future climate conditions. In this video, two of these scenarios are compared across the globe. The strictest of the four emission scenarios (left) gives an average global temperature increase of 1°C by 2100; the laxest of the four emission scenarios (right) gives an average global temperature increase of 3.7°C. The scenario on the right shows the strongest simulated change for the Arctic, which is predicted to heat by more than 10 degrees. In both scenarios, temperature increases are more pronounced over land than over the oceans, as water doesn’t heat as quickly and works as a balancing (cooling) agent. "
And many of us are seeing effects word wide. I ’m in the UK and we’ve had warm wet winters and heat waves in summer. Temperatures of 30 °C in summer are not normal for us. Islands in the Pacific are already disappearing beneath the sea. Five Pacific islands lost to rising seas as climate change hits None inhabited yet but others have had to retreat. World wide, glaciers are retreating, the oceans are becoming more acidic - just slightly so but enough to endanger coral reefs .Australia's Coral Reefs Under Threat From Climate Change We are already seeing record numbers of heat waves. And this is set to continue. This graph shows how temperature anomalies have changed over the northern hemisphere - not a prediction, but a record of what has already happened.
Details from here Heat Waves: The Details. For many of us, climate change is a reality that we are already convinced of, from the effects we can see already with our own eyes.
Freeman Dyson, respected climate skeptic
You can't get much more respectable than Freeman Dyson as a scientist. A Nobel prize winner, he has been in the field of physics for a long time. He has seen the birth of many branches of science. And he is one of the few "all round" scientists who have a good understanding of many areas of physics. He has also been in the field so long that he has talked to many of the scientists who actually made the discoveries of modern science back when their subject was just beginning. However he is not a climate scientist and has never worked in the area. He is not going to misrepresent what a paper says or make up a hypothesis by comparing two graphs and claiming that means there is a cause and effect relation. But he has been a physicist since the early days when they thought long term climate change was the result of a random walk. It's a useful perspective. And I think he rather likes "keeping climate scientists on their toes". So with that introduction here he is talking about climate change.So his main point is that he accepts that global warming has happened. But he thinks it has been beneficial on the whole so far, and he is not convinced that the models predict what will happen accurately on longer timescales into the future. He also thinks that more CO2 will continue to make the Earth more fertile.
This is the greening he talks about:
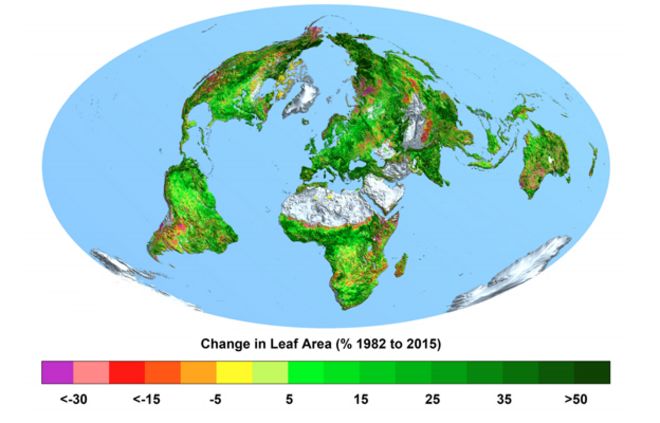
Rise in CO2 has 'greened Planet Earth'
And yes it seems that it has helped so far as far as fertility is concerned. However, this may not continue for much longer. First, some crops such as maize are much more efficient at fixing CO2 than others. Maize already gets all the CO2 it needs for growth so more CO2 will not help it to grow any faster. Other crops like wheat do benefit from the extra CO2, but then you run into the issue that the climate is going to be worse for wheat.
Some crops do benefit all round. Rice particularly. But overall, it seems that we are pretty much close to the optimal level of CO2 for crops right now, and that a further increase will not help and can make things worse.
Large differences even between a 1.5 °C and a 2 °C rise
There’s a summary here: “For example, an extra 0.5 °C could see global sea levels rise 10cm more by 2100, water shortages in the Mediterranean double and tropical heatwaves last up to a month longer. The difference between 2 °C and 1.5 °C is also “likely to be decisive for the future of coral reefs”, with virtually all coral reefs at high risk of bleaching with 2C warming.”Scientists compare climate change impacts at 1.5 °C and 2 °C | Carbon Brief
Note that with 2 °C rise, instead of 1.5 °C, it’s wheat down by 16% instead of 9%. Maize down 6% instead of 3%.
Rice production however goes up 8% instead of 6% so some crops benefit from a warmer world.
Not a problem of survival
The idea isn’t at all that global warming is something we couldn’t survive. Put enough money into it, flood defenses, growing new crops that farmers aren’t used to in their region, relocating people, building new foundations to replace the ones destroyed by melting permafrost in Alaska and Canada, building houses to withstand flood damage, flood defenses or evacuating people from flooded areas, more severe hurricanes, better disaster relief and so on - we can cope with it. But it would be expensive. It might also lead to humanitarian crises in countries like Bangladesh (a poor country that may be severely impacted by sea level rises), low lying countries impacted by flooding in the Pacific, and the Caribbean, and so on. It would impact on standards of living, mean that people have to relocate and mean that poorer people need assistance to mitigate the risks. But we would survive.
Rather, the idea of the climate change agreement is that it is far more expensive to respond to climate change like that - than it is to prevent it from happening in the first place which we can do mainly through policy changes. That it is also better to prevent it from happening than to have to relocate. The Paris agreements might even have economic benefits too, e.g. transition to clean energy leading to new industries. The nations that work hardest on mitigating climate change, e.g. Germany, and for that matter China which is also putting a lot of finance into clean energy, are building up an industry that the rest of the world will want.
Also if we just let the temperatures rise and mitigate the effects, it has environmental effects too which can't be reversed, e.g. 99% of all corals affected by a 2 °C rise compared to 90% for 1.5 °
Not going to run out of food
Earth produces plenty of food for everyone. We get starvation for political and economic reasons. We would have had mass starvation already in the 1960s and 1970s if it weren't for the often forgotten "Green Revolution". But the scientists saved the day, and scientific advances continue to give us higher yielding crops and advances in the ways we can grow enough food for everyone.
Middle of the range progressions have the world population level out at 10 or 11 billion by 2100. We have already reached peak child, the population is growing now because people are healthier and living longer on average with every year that passes. Each year there are the same number of children as the year before.
Also, though agriculture has come a long way, there is a lot we can still do. We are nowhere near the maximum yields for agriculture. Conventional monoculture agriculture requires one acre of farmland needed per person on a vegan diet (4000 square meters approximately). It's optimized to use the minimum number of workers with a single farmer able to harvest large fields of tens of acres with a tractor.
The total land area of the Earth is 148 million km². Enough to feed everyone on a vegan diet nearly five times over. But of course much of that is desert, mountains, ice etc, some is uncultivated and if you have meat and milk in your diet, then animals require more land area than plants.
Reclaiming deserts
You can also use the methods of salt water greenhouses, and other approaches to grow crops in deserts, with enough investment into the infrastructure. This is actually carbon negative, greening the deserts. The sea water is used to make water through the sunlight in the desert, and cool down the greenhouses.
These ideas could be used to reverse desertification in the Sahara desert and other deserts. This is how it works:
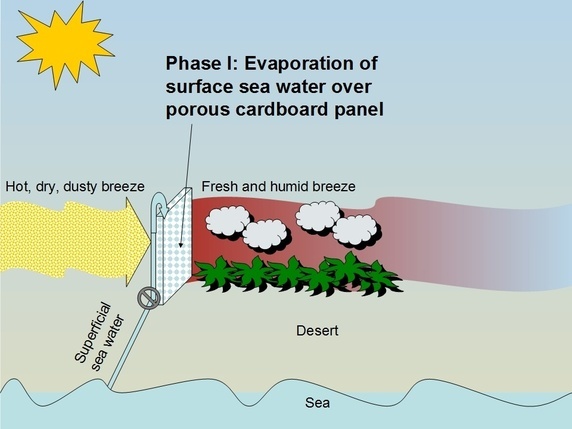
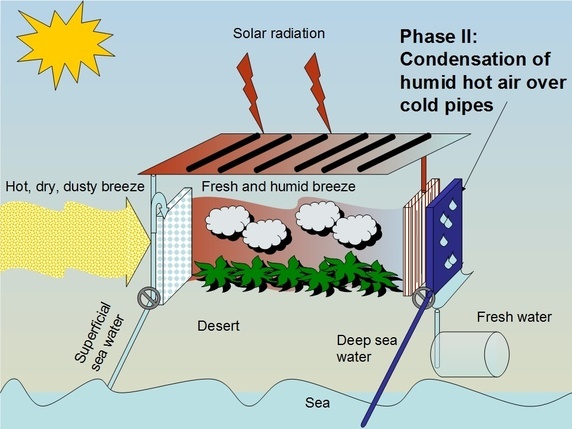
Diagrams by Raffa be from wikipedia
It not only lets you grow crops in the greenhouses - it can also help make the surrounding areas more habitable, so you’d get trees and crops growing in an area around the greenhouses as well. Doesn’t extract anything from desert aquifers, rather, it adds to them.
One of the worst areas of encroaching desertification is the southern edge of the Sahara desert. The first priority there is to stop the spreading desertification - then to reverse it. Many African countries are collaborating in the Great Green Wall project to plant a forest along the southern edge of the desert. Technologies - Sahara Forest Project
Growing more food from a smaller area
By using good gardening practices and by careful choice of crops you can grow all the food for one person in 4,000 square feet, about 372 square meters, or less than a tenth of an acre.
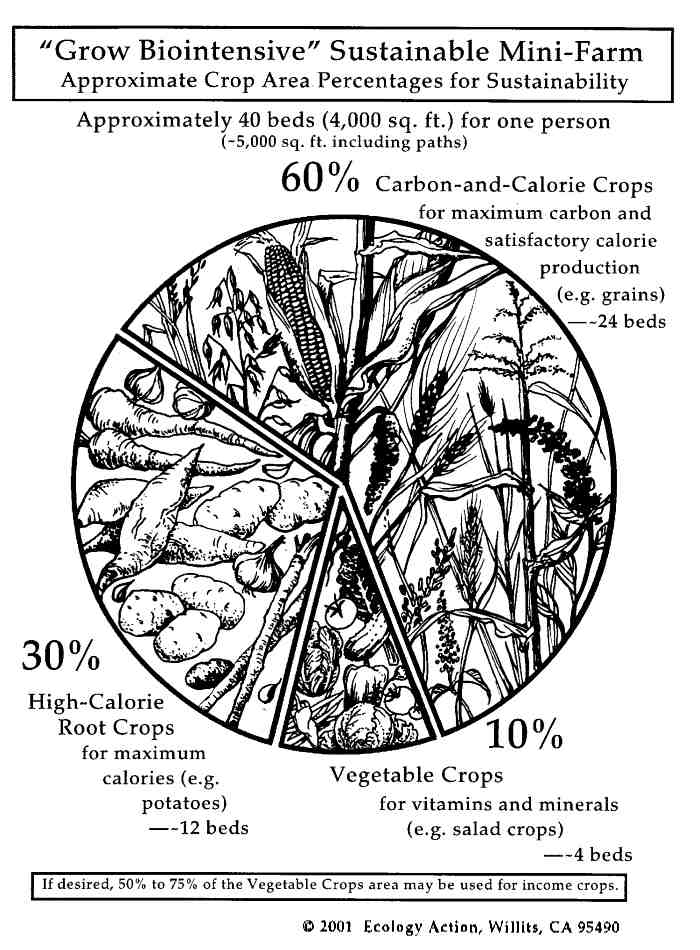
Grow biointensive - sustainable mini farming - this method needs only 372 square meters of growing area per person.
Then if you use the methods developed for possible future use by space settlements, you can grow 95% of the food, water and oxygen for an astronaut from just 30 square meters, with a conveyor belt system, of rapidly growing crops such as wheat, sedge-nut, beet, carrots, etc. For details see Sending humans to Mars for flyby or orbital missions - comparison of biologically closed systems with ISS type mechanical recycling (also relevant to long duration lunar missions).
We can get an idea of how efficient these methods are by working out the total land area needed to feed the world on a vegetarian diet by all the methods. With a million square meters to a square kilometer, then we just need to multiply the numbers by 7,500 to get the area in square kilometers needed to feed the world population of 7.5 billion. We get
- Space habitats method (BIOS-3), 30 m² per person, so 225,000 km² (we could feed the entire world from the area of the UK, see list of sovereign states and dependencies by area)
- Biointensive mini gardening. 325 m² per person, so 2.44 million km²
(we could feed the entire world from the area of India at 3.288 million km²) - Conventional agriculture, 4000 m² per person, so 30 million km²
(we could feed the world on a vegan diet from a little under the area of the US, China and Russia combined)
By comparison, the Sahara desert is 9.2 million km². With the BIOS-3 system, one of the methods proposed for space habitats, we would need only 2.5% of the Sahara desert to feed the entire world. In the future, if we develop seasteading, we could feed four times the world population from floating sea cities and farms covering 0.5% of the Pacific ocean - cities that grow all their own crops and use nothing from the sea for the crops, except sea water like the seawater greenhouses in deserts. See Seasteading
(I wrote this section originally for my An astronaut gardener on the Moon - summits of sunlight and vast lunar caves in low gravity)
What do we need to do to stay within 1.5 °C
The climate scientists have a fair bit of confidence in the IPCC figures, and I've explained why that is, so for the rest of this article I'll focus on the IPCC predictions. If you read their predictions, you will see that there are some things that they are very certain about, some things they think are likely, and so on. The most accessible of their reports are the summaries for policy makers.
The IPCC worked out various scenarios, published November 2014, and they worked out that based on the current models, to remain within 1.5 °C then we need to add no more CO2 before 2050 than we would do in 6 more years of "business as usual". That's the limit if we want to keep within a two thirds chance of staying below 1.5 degrees"
That takes us to the end of 2020. So we have to reduce drastically before 2020 to have a chance of keeping the total CO2 emissions up to 2050 the same as 4+ more years of business as usual. So, we don't just have to reduce emissions from 2020 onwards. We have to reduce emissions drastically well before 2020 to have a decent chance of remaining within 1.5 °C by 2100. The higher targets of 2 °C are more easily achievable.
It is because of projections like that that they feel we have to act quickly. And for many of us we can see unusual weather changes already such as the Arctic melting, the unusual warm winters here in the UK for several years now, heat waves in the summer retreating glaciers world wide, coral bleaching in Australia. We don't need to wait any more for it to become more obvious that it is going to happen. It doesn't seem like a good deal to us, to just do nothing and hope that the few who think that the climate predictions are inaccurate turn out to be right after all, despite what seems lots of evidence that the Earth is warming exactly as predicted by the IPCC back in the 1980s.
That's why it is so urgent, if the climate models are correct. Why we can't just sit around and discuss it but if we are going to act on it, have to act quickly, if we want to remain within 1.5 °C.
Paris agreement - what the countries are doing
The new Paris agreement is very different from the last Kyoto agreement. There is no global CO2 tax and nothing "imposed from above". Instead the countries are making voluntary pledges to reduce emissions. The US foreign secretary Kerry was one of the principle architects of this plan. So the US has been amongst the leaders in this initiative so far.
This approach worked much better than the Kyoto approach, surprisingly well. The countries are vying with each other to put forward the most ambitious carbon dioxide reduction plans. They are using many different approaches. They can use a CO2 tax internally if they want to but only a few have opted for that approach.
There is a new sense of urgency and of everyone working together. This site is useful, tracks the countries and rates them according to whether their actions are inadequate, medium, or sufficient.
Since Trump has claimed it is all a plot by China, let’s look at what they are doing: China - Climate Action Tracker. As you can see, they are one of the countries doing a fair bit to deal with climate change. China is set to peak CO2 emissions between 2025 and 2030. That's not sufficient to achieve the target of 2 °C by 2100, but they are keeping well within their pledges for the treaty. As with most countries they have to work harder to get down to 2 °C and even more to target 1.5 °C and so we hope they will make more pledges as the process continues.
China is also the country with the largest installed capacity of solar panels. It exceeded the German levels of solar panels by the end of 2015 reaching 43 GW of installed capacity and added an extra 20 GW in the first half of this year, encouraged with a feed in tariff. Indeed they have so much installed that they have a problem of excess capacity in some provinces (which is also an issue in Germany). They plan to add 15 to 20 gigawatts of solar capacity each year for the next five years to bring the total installed solar power in China to more than 140 gigawatts. They have made a significant impact on the world solar capacity, which reached 200 gigawatts last year and is expected to reach 321 gigawatts by the end of 2016. See China is on an Epic Solar Power Binge. They are building a 2 GW solar farm in the Ningxia region, with six million solar panels. This will be the largest solar farm in the world, indeed larger than the installed capacity of many countries.
The poorest countries are amongst the ones doing most. Ethiopia is top of the list, set to keep us within 2 °C by 2100. Ethiopia - Climate Action Tracker They also plan to increase their pledges before 2020. Bangladesh, Ethiopia, Haiti and 44 other countries members of the “Climate Vulnerable Forum” have said they will update their pledges before 2020, with an aim of 100% green energy between 2030 and 2050 if they get economic and technological support to achieve those goals World's poorest countries to aim for 100% green energy - BBC News
We should all try to follow suit if we want to stay within 1.5 °C, to get as close as possible to zero emissions by then. It's the same over most of the world, the general feeling is that we have left it so late, and we need to reduce emissions quickly, by substantial amounts already, over the next four years.
The Paris agreement has world wide political support from countries and parties of all political persuasions. For instance, here in the UK it has cross party support of all the major parties. No objections were raised by anyone in either house. World wide it has support from governments of all political persuasions, unless you think Saudi Arabia, and Iran have left wing governments! It also has support from the most capitalist countries as well as the most communist ones. This is the 2015 list of the most "economically free" countries. Their top ten countries in descending order are Hong Kong, Singapore, New Zealand, Switzerland, United Arab Emirates, Mauritius, Jordan, Ireland, Canada, and the United Kingdom tied for 10th with Chile. Of those, all except Ireland and Hong Kong have already ratified the treaty.
Scientific backing
The most quoted figure is 97% of climate researchers, see Scientific consensus: Earth's climate is warming but some surveys come up with a figure of 100%. Here is a summary of the evidence for the 97% figure:
"Nevertheless, the existence of the expert consensus on human-caused global warming is a reality, as is clear from an examination of the full body of evidence. For example, Naomi Oreskes found no rejections of the consensus in a survey of 928 abstracts performed in 2004. Doran&Zimmerman (2009) found a 97% consensus among scientists actively publishing climate research. Anderegg et al. (2010) reviewed publicly signed declarations supporting or rejecting human-caused global warming, and again found over 97% consensus among climate experts. Cook et al. (2013) found the same 97% result through a survey of over 12,000 climate abstracts from peer-reviewed journals, as well as from over 2,000 scientist author self-ratings, among abstracts and papers taking a position on the causes of global warming.
"In addition to these studies, we have the National Academies of Science from 33 different countries all endorsing the consensus. Dozens of scientific organizations have endorsed the consensus on human-caused global warming. Only one has ever rejected the consensus - the American Association of Petroleum Geologists - and even they shifted to a neutral position when members threatened to not renew their memberships due to its position of climate denial.
"In short, the 97% consensus on human-caused global warming is a robust result, found using several different methods in various studies over the past decade. It really shouldn't be a surprise at this point, and denying it is, well, denial."
If you are skeptical of this, do read what they say and follow through and read their rebuttals of the denials. If you just read what climate skeptics say and don't read the rebuttals you have an unbalanced picture. It may well be that the consensus is much more than 97% because with some of these studies they don't assess articles if they don't say either way what the view of the authors is. It is such a consensus now amongst climate scientists that if you don't say anything about it, that normally means that you accept the consensus just as for articles on continental drift or the meteorite impact theory of origin of the lunar craters.
Here is a climatologist criticizing the 97% figure as not high enough. The author says that papers written about effects of climate change, mitigation etc should be taken as endorsing unless they explicitly reject it, similarly e.g. to papers on continental drift or the impact origin of lunar craters which will only very rarely explicitly endorse the established theory. On that basis rather than 97% it's more like 99.9% or more
"Of 24,210 abstracts, only five—one in 4,842 or 0.021 percent—in my judgment explicitly rejected AGW. Two of the articles had the same author, so four authors of 69,406 rejected AGW. That is one in 17,352, or 0.0058 percent."
Climate skeptics arguments
There are many arguments from the climate skeptics, and if you want a thorough overview, see this page here: Global Warming&Climate Change Myths. So I'm not going to try to cover them all, but just to cover some of the main ones that came up in discussions since my previous article on this subject.Argument that land temperatures are lower by one degree °C so the global warming must be over
There are many newspaper reports just now saying that land temperatures have fallen by 1 °C, the largest drop recorded since records began. However, they just say land temperatures there, it's not about ocean temperatures. And this is a drop in temperature at the end of the warmest year on record.
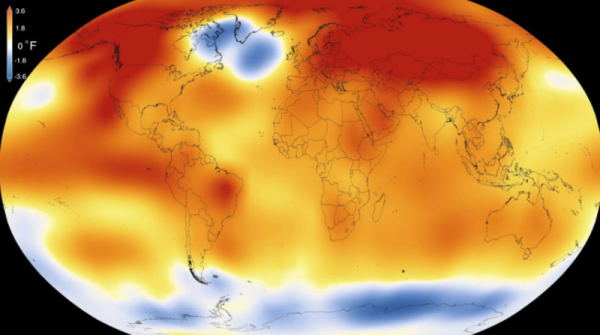
The global average in 215 was the warmest since modern records began in 1880, and 2016 will be even warmer. Here red means hotter than in 1880, white means it is the same temperature and blue means it was cooler. It's not uniform, first, this is the average for the entire year. Also, notice that a few places are cooler, and the Arctic is the warmest of all. But on average the Earth is warmer.
We get many fluctuations in the temperature of the surface of the ocean. El Nino brings warmer water back to the surface, but doesn't warm up the Earth as a whole. We are now headed for a La Nina so can expect the Earth to be a little cooler than it would be on average, until the next El Nino event. You get a better picture from the global heat reserves in the land + ocean.

See Global cooling - Is global warming still happening?
The changes are most dramatic in the Arctic.
The Arctic is amongst the most affected by climate change - with the ocean almost ice free in recent summers. Earlier this autumn, it was 20 °C (36 °F) warmer than usual.
See that red spike to the right - that shows how much it is above normal temperatures for this time of year in the Arctic
The North Pole is an insane 36 degrees warmer than normal as winter descends
For the last four years the ice cover in the Arctic has been well below the average values for 1981 - 2010 every single year.
Figure from Arctic Sea Ice News. And it is losing its older ice. Here is a good article here with a graph showing how the Arctic is losing its older ice

In that context a moment with a one degree drop in land temperatures after the warmest year on record doesn't seem like a dramatic turn around of global climate.
The NOAA is deceptively changing past temperature figures
This is all above board. They have to adjust temperature figures to take account of differences in the way that temperatures are measured. Please read this to understand why they make those adjustments. No climate conspiracy: NOAA temperature adjustments bring data closer to pristine
Volcanic eruption myth
The first is the myth that a volcano emits as much CO2 as all humans produce in a single year. In actuality humans emit about 32 billion tons of CO2 a year. All the volcanoes put together emit on average 200 million tons each year - estimate in this Scientific American article. So a normal single volcanic eruption is nowhere near the amount of CO2 that humans produce in a year, even all the volcanic eruptions for an entire year produce only 0.625% of the total CO2 added by humans for that year. The volcanic eruption contributions of course are in steady state part of the slow carbon cycle which helps to keep the Earth warm enough for life (otherwise it would be -25 °C) and also fertile (plants would have no CO2 to fix if the volcanoes stopped returning CO2 to the atmosphere).
On volcanoes, then they are of course random and unpredictable. But they have produced just the right amount of CO2, millennia after millennia for millions of years to keep Earth at around its present temperature. They don't suddenly all stop for a long time and plunge us into a snowball Earth, nor do they produce huge amounts of CO2 in a big belch. It's because the CO2 is the result of subduction of limestone and chalk and so on as continents move beneath other ones and that is an on going continual process.
As for a supervolcano - then it actually reduces the amount of CO2 in the atmosphere. That paradoxical result is because the dust from the volcano, carried around the world, cools the world down. A cooler world can absorb more CO2 so for a few years the Earth is absorbing more CO2 than usual and so the concentration in the atmosphere decreases rather than increases. . In one study, the researchers
"...simulated Pinatubo-like eruptions (Volcanic Explosivity Index VEI 6) every 5 years in one model run and Tambora like eruptions (VEI 7) every 25 years in another model run for the period 2000 to 2100 where CO2 emissions follow the IPCC-A2 scenario. They demonstrate that the smaller but more frequent eruptions have a larger impact on the carbon cycle than the less frequent larger eruptions. At the end of the integration in 2100, the atmospheric pCO2 is 46 ppmv lower than in a control experiment without volcanic forcing."
Bogus "scientific consensus" claims
Just a warning to watch out for them. This is an example from Forbes magazine from 2013. Claims that two thirds of engineers and geoscientists are climate deniers. But when you read the small print it turns out to be a survey of 1077 self selected subscribers to the PEG Magazine, published by the e "Association of Professional Engineers, Geologists, and Geophysicists of Alberta". One of the big industries in Alberta is the petrochemical industry. That's actually the main focus of the report, which doesn't claim to be representative of engineers and geoscientists generally. It contains a long discussion of awareness of climate change amongst petrochemical engineers.
So actually it was saying that in this small sample from Alberta, two thirds of geochemists and engineers, many of whom who work in the petrochemical industry are climate deniers. That a third accept global warming is the more impressive figure there I think. And that is three years ago. Many in the petrochemical industry are gearing up for transition to clean energy and finding new ways ahead for their companies, so the figures have probably changed since then.
Is there a conflict with coal, oil and gas?
Actually CO2 reduction doesn't have to mean direct conflict with coal, oil and gas. Probably the best way to deal with the situation involves transition to a mix that includes a fair bit of renewable energy, as well as probably nuclear power to ease the transition for a few more decades. But actually, we can continue using some fossil fuels as well so long as we use carbon capture and storage technology.
You can burn coal with hugely reducing emissions with carbon capture and storage. It has a lot of potential to help reduce CO2 during transition to renewables, when we are still burning coal, oil and gas. Our government in the UK short sightedly (in my view) pulled the rug from under a $1 billion CCS competition just days before the Paris agreement
This technology also is one of the few technologies that can actually generate power not just in a carbon neutral way but even in a carbon negative way, if it is used to burn biomass. It actually takes CO2 out of the atmosphere to grow plants, and then burn them, if you capture the CO2 emissions from burning them.
What is Carbon Capture and Storage
Methane emissions
The Clathrate Gun hypothesis is often used by climate skeptics in the other direction. They will sometimes argue that the climate is going to get unbearably hot no matter what we do, so there is no point in doing anything. But the timescale for methane release from the sea floor in a rapidly warming climate is a thousand years, not decades, which rather puts that to rest. As for methane from permafrost - then as it warms up, the methanogens that love to munch on methane flourish and eat the methane so very little of it will actually reach the atmosphere.
Also methane has a short half life in the atmosphere, about a decade (depending how you calculate it).
WHAT ABOUT LIVESTOCK, AND JUST HUMANS BREATHING?
This is something you might well ask if you have watched “cowspiracy”. However it exaggerates the situation. For a criticism of the film by the union of concerned scientists: Movie Review: There’s a Vast Cowspiracy about Climate Change.
Livestock produce 8-18% of greenhouse gas emissions according to the paper they cited, not the 51% of Cowspiracy - that is for all livestock world wide, not just beef. It's still a lot. But there is no conspiracy to hide this. It seems a very active area of research with many papers. These are the google scholar search results for 2016.
Methane has a much shorter residence time in the atmosphere than CO2. Around twelve years compared to 100 years for CO2 (however the situation for CO2 is complex, some of it is removed within 50 years, some remains for thousands of years, more on this later). For the figures see The Scientific Basis
As for CO2 from breathing, then that’s carbon neutral. Every time you eat, you convert food to CO2 which you then breathe out. However that food would have decayed anyway so you are just speeding up the process of decay. When the farmer grows the food next season all the CO2 you breathed out gets taken up again into the plants. The same is true for all oxygen breathing life including all animals, insects, fungi and many forms of microbe (the "aerobes"). The CO2 they breath out gets taken up by plants and algae. Due to this fast cycle, on average each molecule of CO2 depends only four years in the atmosphere.
That’s also the reason for the oscillations every year in the CO2 concentrations graphs, because most of the Earth's land mass is in the northern hemisphere, and so the contributions to this cycle due to plant growth happen mainly in the Northern hemisphere.
Uneven effects of sea level rise
It is a rather similar for the oceans. You might think that a sea level rise has to happen uniformly over the entire world, as after all the oceans are interconnected. But no, they don't rise uniformly. As an example, New York experiences a much higher sea level rise than normal while London will have a much lower sea level rise than normal for the same average sea level rise.
There are several effects here
- Parts of the Earth are still rising as a result of the ice sheets withdrawal at the end of the last ice age
- With a warmer ocean, the distribution of water across the globe changes
- The mass of ice in Greenland and Antarctica exerts a gravitational pull on the water closest to their coasts, raising the sea level there .As the ice melts then this gravitational pull is reduced, so the water previously piled up around Greenland and Antarctica gets redistributed over the globe.
You might wonder how something so small as an ice sheet can have enough gravitational pull to raise sea levels. But a mountain sized mass just one kilometer away from you has four times the pull as the same amount of matter two kilometers away and a ten thousandth of the pull as the same amount a hundred kilometers away. Although the way the maths works is that it adds up so it has the same effect on you as a point with the same mass as the Earth at its center, the matter that is close to you has most effect, counterbalanced by a tiny pull from large amounts of matter far away from you. So a small change in the mass distribution close to the sea can have a significant effect on the sea levels around the coast.
Of course any mountains close to the shore will exert a gravitational pull on the sea, but only the ice sheets, by melting, can change that pull.
They used two scenarios in their models. Their high end scenario contributes 30 cm of sea level rise by 2100 and their mid range scenario contributes 7 cm by then. The increase in the rate of ice loss per year (every year) for the two scenarios were 2.5 and 19.1 gigatons per year respectively. The rate of ice loss increased by on average 14.5 Gt per year each year over the period from 1992 to 2012 so at present we are running closer to the high end scenario than the low end one.
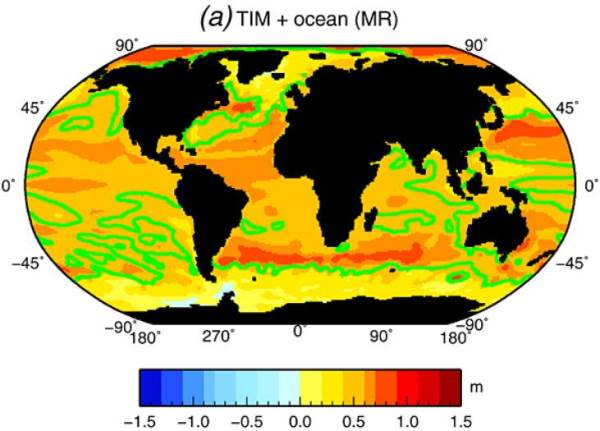
In this figure, from the paper describing this research in 2013, the green line outlines a region with a 0.5 meter sea level rise for the scenario of a 7 cm (MR) rise in average sea levels.
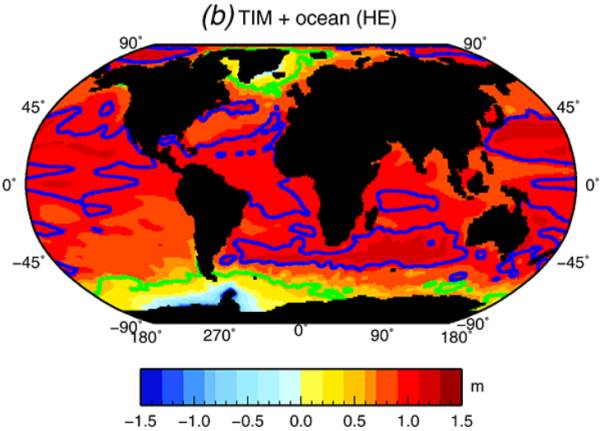
In this figure, the green line outlines a region with a 0.5 meter sea level rise, and the blue line outlines a region with a 1 meter sea level rise for the scenario of a 30 cm (HE) rise in average sea levels.
The result of this is that places like Scotland and Scandinavia may see almost zero change in sea level from ice melting, because they are influenced by the mass loss from Greenland. Only the thermal expansion of the oceans will matter there. While with the high end scenario for global warming, sea level rises could reach a meter in the Western Pacific. There, many people live on low islands made up of coral and may need evacuating. It also has severe impacts on some of the coastal regions of North and South America, the Caribbean, the West coast of Africa, Eastern Australia and some other places. In the Americas, the Bahamas are particularly affected as is Florida and many coastal cities. Discussion of this here: Ice Melt Means Uneven Sea Level Rise Around the World
Effects by 2100
The IPCC has already said that the sea levels will rise by up to one meter by 2100 if we don't use stronger methods to limit greenhouse gases. These graphs are from their summary for policy makers from 2014.
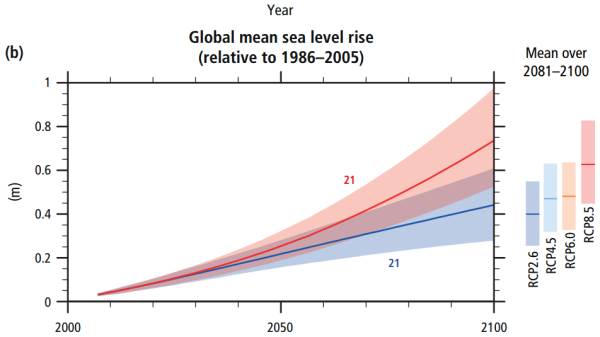
There the RCPs are the Representative Concentration Pathways considered by the IPCC. RCP 8.5 is business as usual. RCP 2.6 has emissions peak before 2020 with an immediate and rapid decrease in emissions, roughly what the Paris agreement is attempting to achieve. RCP 5.6 has a peak around 2040 and RCP 6.0 has a peak at 2080.
This shows the temperature changes for the business as usual and the rapid reductions scenarios.
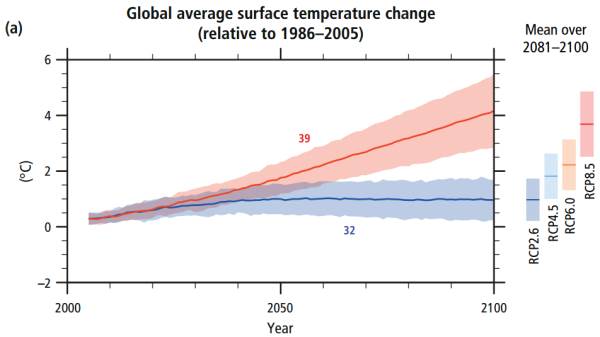
- RCP 8.5 is "business as usual" with emissions continuing to rise. Temperature rise by 2100: 2.6°C to 4.8°C, sea rise 0.45 to 0.82 m
- RCP 6.0 has emissions peak at 2080, temperature rise 1.4°C to 3.1°C
- RCP 4.5 has a peak around 2040, temperature rise 1.1°C to 2.6°C
- RCP 2.6 has them peak before 2020, temperatures: 0.3°C to 1.7°C. Sea level rise 0.2 to 0.6m
The temperature increases there are measured relative to the average for 1986–2005
There are many uncertainties there as you can see by the range of values with 2.2 °C difference between the projections for 2100. It's also possible that the temperatures are above or below those numbers. The same applies even more for the rising oceans. The big uncertainty there is about the rate of melting of the ice sheets in Greenland and Antarctica. The rate at which they are melting has continued to increase, year after year, and the estimates depend on how much this rate continues to increase. More on that in the next section.
See the article in the Guardian about the guide to these scenarios
This again shows the uneven sea level rises for two of the scenarios:
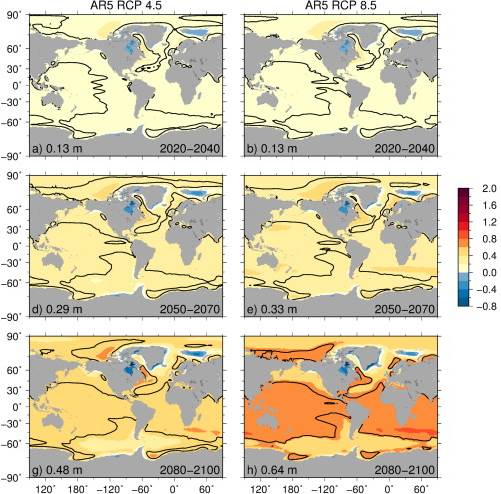
Sea level rises for 2030, 2060 and 2090 for the scenarios RCP4.5 (middle range) and RCP8.5 ("business as usual"). The black lines are contours for the middle of the range sea level rise so mark the boundaries of areas of the sea that rise less than normal and areas that rise more than normal.
This map is not entirely consistent with the previous one. This is the more recent paper from 2016, so probably the more accurate. However it is also very low resolution.
Longer term effects - collapse of the western antarctic ice shelf
But what happens further into the future in the future? Well eventually, with "business as usual", the Greenland ice sheet is likely to melt completely leading to a sea level rise of 7 meters average, and much higher in some parts of the world. The threshold for this to happen is probably less than 4 C relative to pre-industrial and it may happen even with a 1 C rise. But this is likely to take a thousand years (it takes a long time to melt all that ice). What about the nearer future, in the 22nd century? In these new studies, a team of glaciologists using satellite and air measurements say that the ice in Western Antarctica has already started a process that is probably impossible to stop. With ice penetrating satellite radar mapping of the terrain beneath the ice (using the EU Sentinel 1 satellites), they say that here are no mountains or hills significant enough to slow the collapse. The fastest melting glacier, Smith glacier, is losing 70 meters thickness of ice a year. It's grounding line - the point at which it starts to float on the sea - is retreating two kilometers a year and has been doing that since 2011, is continuing unabated.
There are six glaciers that will collapse, enough to raise the sea level another four feet. But these may collapse other glacier leading to a rise of sea levels triple that. A separate team studying just one of the glaciers, Thwaite glacier, came to the same conclusion that collapse is inevitable. That is, will happen anyway, based on the CO2 emissions so far.
If so then this would cause a 10 foot rise in sea level. This would cause issues for coastal cities like New York and low lying countries like the Netherlands and Bangladesh which is the area in the world likely to be most affected by sea level rise since much of the country is not far above sea level.
They spotted a new rift which may lead for a large ice sheet to break off again, like the giant 225 square mile "iceberg" of 2015.

Rift in Pine Island Glacier ice shelf, Credit NASA/Nathan Kurtz.They say there that many think it is inevitable that the Western Antarctic ice sheet will disappear. The main Antarctic ice sheet is still growing. Antarctica has been growing steadily all through the glacial and interglacial periods which is why we have these long ice cores to look at the temperature changes in Antarctica in exquisite detail. If we continue "business as usual" it will stop growing and eventually thousands of years into the future, melt completely. But that is not a risk at present. The risk is just from the Western ice sheet. But because the ice rests on land, rather than on the sea, adding this to the oceans will raise the height of the oceans, and they estimate by 10 feet so about 3 meters.
So what effect will it have if they are right? Not end of civilization. But some major issues. Florida is amongst the most affected since the underlying geology is porous limestone. This means it will be impossible to build conventional flood barriers as the sea will just percolate through the rock beneath them. So it seems inevitable that Florida will be flooded if sea levels rise. Only mitigation, such as evacuating the affected regions, or preventing climate change is possible as a way ahead.
Here it is as it is now. The areas shaded are not mapped.
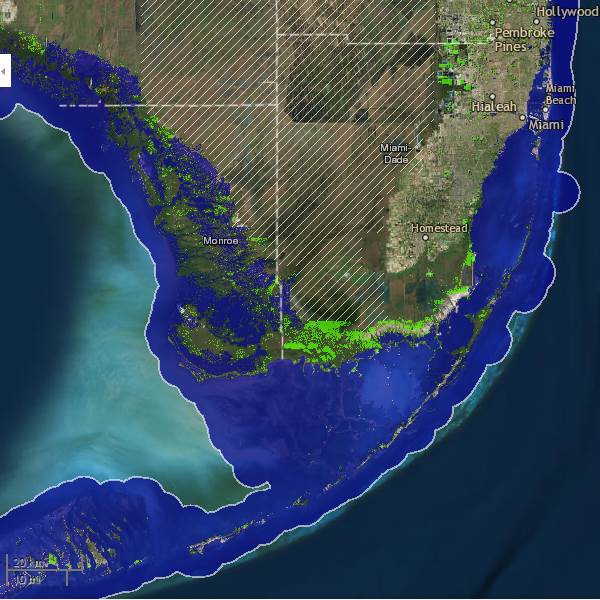
Florida at current sea level (click to go to interactive map)
Here it is at 3 feet
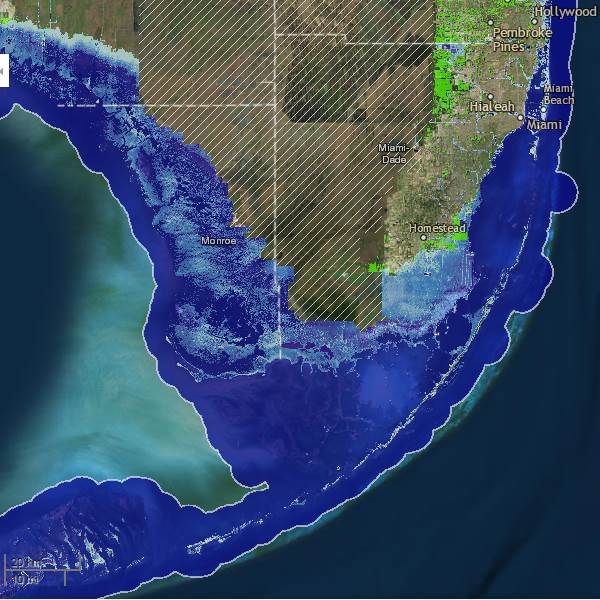
Florida at 3 feet - a level likely to be reached by 2100 with "business as usual"
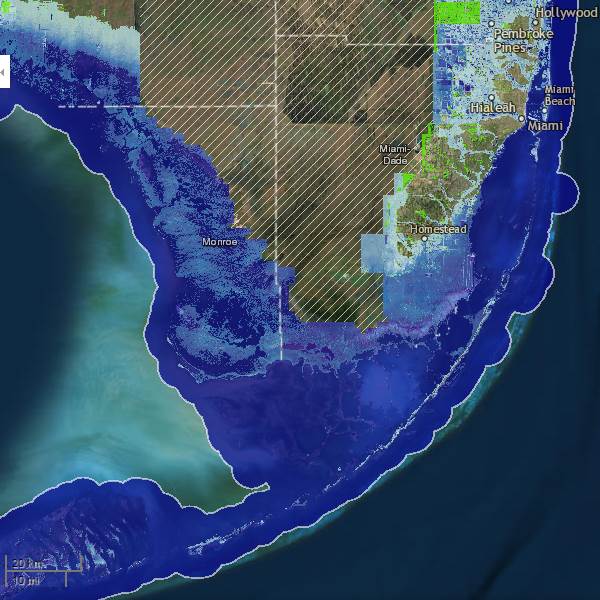
Florida at six feet, a level likely to be reached in the 22nd century if the West Antarctic ice continues to melt. Some think we may reach that level sooner, even by 2100, with "business as usual"
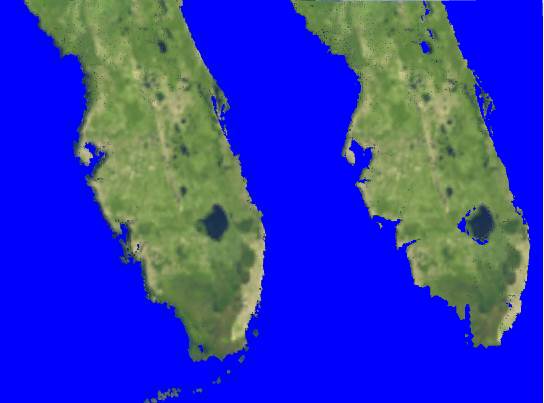
Florida before and after a 3 meter sea level rise due to melting ice from the Antarctic and Greenland ice sheets. Image made using the Eustatic Sea Level Change tool from Virtual Earth System Laboratory (VESL).
It is already getting affected more than usual by hurricanes because of the one foot the sea has risen by so far. See Goodbye Miami for an article in Rolling Stone magazine about these issues.
However, remember that Florida is in an area that is much more affected by the global sea level rise than the average, so it may be flooded much more than this. The Bahamas are also impacted. Just a 1.5 or 2 C rise in temperature will already have a significant impact there. 5% of the population of the Bahamas would be displaced if the sea level rose by one meter.
Sea level maps
You can have an explore of the world to get a rough first idea of the effects of local sea level rises with this interactive map
Global sea level rise map. This map was created by Alex Tingle using Google maps and NASA elevation data.This shows Florida, the Bahamas and Cuba after a 9 meter rise.
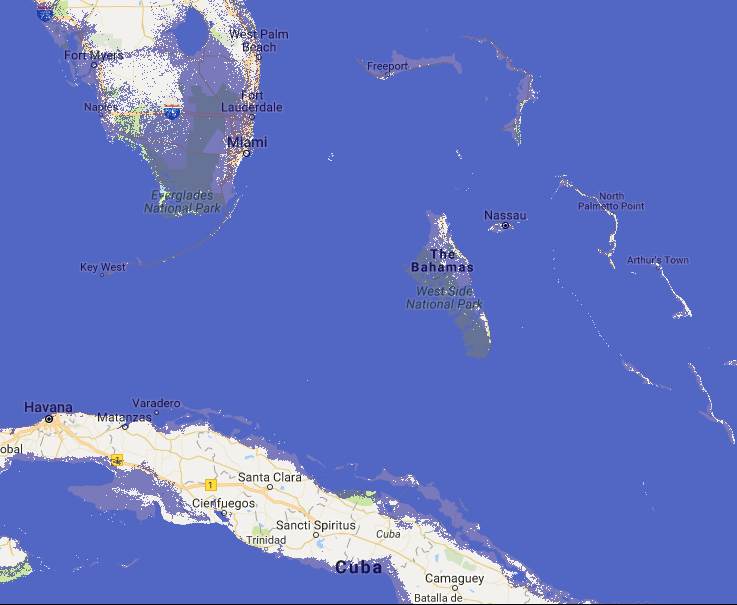
It uses NASA altitude data which is approximate. It also just maps a new sea level against the topography of google maps. Places that are inland below sea level of course will not experience sea level rises even if shown flooded in the diagram (you need to trace out to see if there is a connection with the sea). But in the case of Florida, since the underlying rock is porous, then the map probably pretty much shows what the effect would be no matter what flood defenses are used.
Also it doesn't take account of the uneven nature of sea level rise around the world. You need to dial in your local sea level rise if you know what it is projected to be.
Surging seas map
For a more accurately done map - but one that is slower to navigate unless you have a fast internet connection, see the Surging Seas. It takes account of local differences when working out sea level effects and also takes account of areas contiguous to the sea. To find out when your area will be affected by the various sea level rises, then click on Projections on the map and then choose the relevant scenario and it will show the date by which that sea level rise is projected to happen, if it happens before 2200.
Use this to get a better idea of what the effects would be. But for sea level rise especially, its estimates for when you will reach a particular sea level for the various scenarios may be an underestimate, as the IPCC projections are regarded as quite conservative.
NOAA map
The maps I did for Florida used the NOAA map, which is detailed and accurate but is only available for the USA. You can find it here, Sea Level Rise Viewer.
Conversion of global to local sea level rises
One big problem I had with the material here on flooding, is that I can't find a good high resolution map to convert global sea level rises into local sea level rises. E.g. how much of a rise do you get at Florida for a global sea level rise of 1 meter? The sea level maps suggest anything between over 3 meters for the first map (if it scales up similarly to the 30 cm rise), and a little over 1 meter for the second one. The second one is published three years later but is very low resolution. Both indeed are so low resolution it is hard to be sure what the situation is for a small region such as Florida
The IPCC summary for policy makers from 2014. reports says
" Sea level rise will not be uniform across regions. By the end of the 21st century, it is very likely that sea level will rise in more than about 95% of the ocean area. About 70% of the coastlines worldwide are projected to experience a sea level change within ±20% of the global mean"
But it doesn't say how to identify the 30% of coastlines that have sea level rises more than 20% above or below the global sea level rise, or how to find out how much of a rise they get.
The Storm Surge site lets you show when the sea level rise you dial in is reached for a few selected points on the map according to the two scenarios they give but they don't say how to convert global to local sea level rises either. Does anyone reading this know of anything on this.
Other places vulnerable to sea level rises
World wide then naturally the Netherlands are amongst the most affected. As a rich country they would be able to increase the height of their flood defenses but it would be expensive. Other coastal areas in France, Belgium, Denmark and the UK (e.g. the Norfolk broads) would also be affected.
Here is the area as it is now:
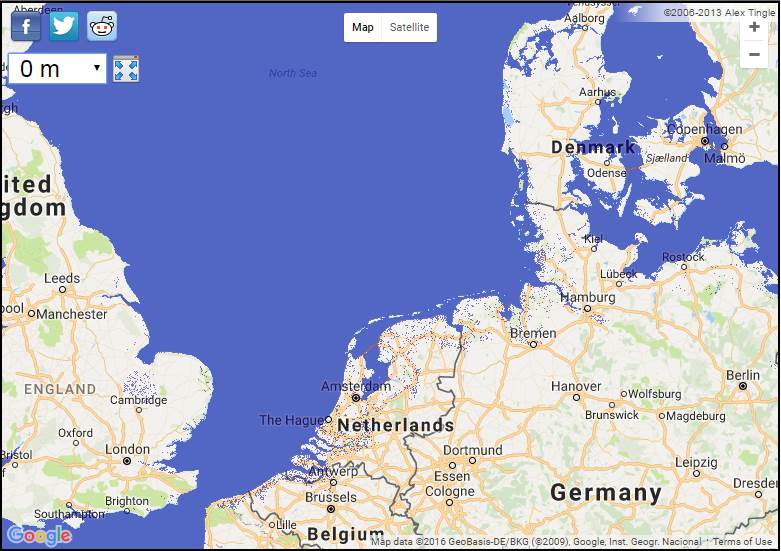
And after a 3 meter rise. Remember only places that are shown as blue and connected to the sea would actually be flooded. Unless the geology is porous, inland areas below sea level would not be affected, and the Netherlands particularly can be expected to build better flood defenses, though a 3 meter increase in height of them would be an expensive undertaking. However I'm not sure what the local sea level rise would be there, for a 3 meter global rise.
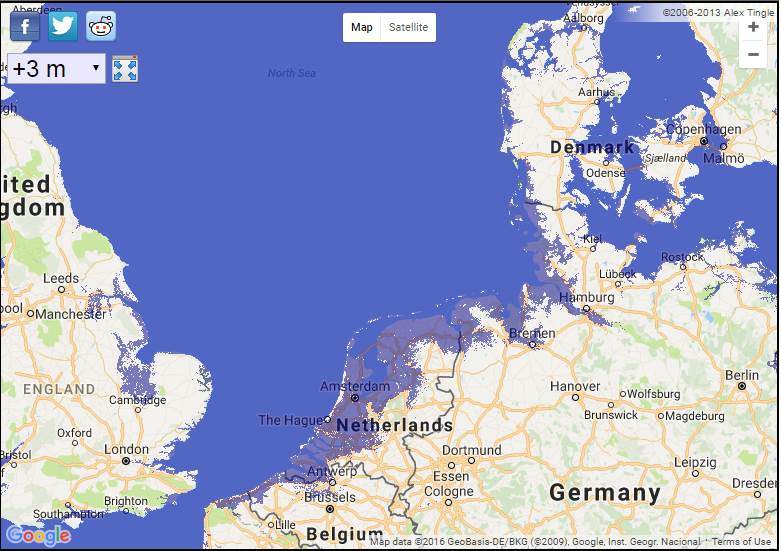
Then finally, this shows the effect for Bangladesh of a 3 meter rise. This is likely to be an overwhelming humanitarian issue for a poor country with a huge population and they would surely need external help to deal with the issues. I'll do it as links to the images:
And after a 3 meter sea level rise such as might happen by 2100 if the western Antarctic ice sheet melts
(I will see if I can get some better maps for Bangladesh and for the Netherlands area)
A ten foot rise in sea level will not mean the end of civilization at all, but it will lead to major problems for several particularly vulnerable spots world wide.
Even if we stop all CO2 releases, unless we actively remove it from the atmosphere, then it's going to continue to warm the oceans, and melt the ice long into the future. That's because of the long time that CO2 remains in the atmosphere, the yet slower response of the ocean levels to the warming Earth, and the even slower response of the melting ice sheets. The Greenland ice sheets are melting fast, losing 270 billion tons of ice a year. There is a lot of ice there. It should take thousands of years for it to all melt. But if it all melts then the sea levels will eventually rise by 7 meters.
That should be no problem, if it happens slowly. Eventually we have to abandon coastal cities such as New York, London, etc. Or we build massive flood barriers. Or we actively remove CO2 from the atmosphere. Over timescales of thousands of years, we could do any of that.
Need for political decisive action
As you can tell from this article, there is still a lot of uncertainty in the models, and they will continue to refine them surely for decades into the future. There are many details that they can model and look into. Also computers will continue to become more powerful, permitting more detailed models taking account of more and more effects. Although they think they have a reasonable understanding of what will happen, there is plenty of reason to continue to debate it and to work on the fine details of what is going to happen. How much will the temperature rise with business as usual? Or have we got it all wrong and it won't 'rise at all? Or what if it rises much more than expected?
At that point it becomes a political rather than a scientific decision. The scientists have done the best they can with their models, and continue to do so. They provide their best projections for the future, along with estimates of how certain they are. As is usual in science, then there are a few outliers in both directions, scientists that think the effects will be more than predicted and others who think they will be less than predicted. And sometimes the minority view in science turns out to be right. If we wait for certainty however, it will be too late to act, if the IPCC is right that we need to act swiftly to prevent the worst of the effects.
The politicians and the general public who vote for them then have to decide what to do with this information. In the past, this has been a matter for a great deal of political debate world wide. But now, in the rest of the world outside the US, that debate has already reached a conclusion, and we've moved on to action. There were many actions we could have done, but this was the decision embodied in the Paris agreement. While in the US politicians are still debating it.
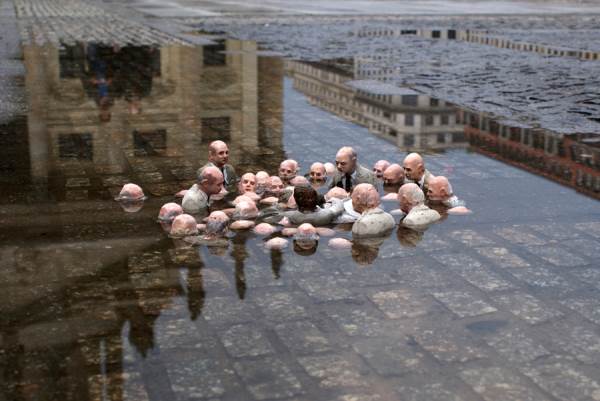
This image is being shared on social media as "Politicians Discussing Global Warming." - although that's not the original name of this work, originally called "Follow the Leaders" It was an installation by the sculptor Isaac Cordal in Berlin in 2011. The new title is more powerful though. At some point we have to stop debating and act. The rest of the world have decided they have had enough debate and it is time to act already. But US is still debating and has elected a climate skeptic next president.
Many US companies are asking Trump to stay with the Paris agreement: including DuPont, Gap Inc., General Mills, Hewlett Packard, Hilton, HP., Kellogg, Levi Strauss., L'Oreal USA, NIKE, Mars, Schneider Electric, Starbucks, VF Corporation and Unilever.365+ Businesses Call on Trump to Support Paris Climate Agreement
I think that perhaps once Trump is president, it might be that it becomes more and more difficult to maintain his climate skeptic stance once he finds that he is the only world leader saying this - he would feel like an outsider in a party wherever he goes on the world stage. As president he will have to give words of reassurance after hurricanes, droughts, wild fires etc.
He is not a complete climate skeptic. He has said that he thinks that there is some interconnection. And as well as that he showed through business decisions that he thinks global warming is happening and will continue to happen. Trump's wall to protect his Scottish golf course from climate change flooding is in the news in the UK. He wants to build a wall along the sea shore to protect it from rising seas due to climate change. They are running into difficulties getting it past planning permission. Actually mentions flooding due to climate change as a reason for building the wall. These are quotes from the planning application as reported in Politico:
“As with other predictions of global warming and its effects, there is no universal consensus regarding changes in these events. Our advice is to assume that the recent average rate of dune recession will not alter greatly in the next few decades, perhaps as far into the future as 2050 as assumed in the [government study] but that subsequently an increase in this rate is more likely than not.”And Guardian article about it here.
“...A Do nothing/Do minimum option will have the least impact on [natural] processes but the existing erosion rate will continue and worsen, due to sea level rise, in the next coming years, posing a real and immediate risk to most of the golf course frontage and assets,”
The US is strong in clean energy, and the technology for clean energy. However, its per capita CO2 emissions are still amongst the highest in the world, far higher than China for instance, which means there is a lot it could do to show a lead here. China's emissions are 7.6 metric tons per person per year. UK's emissions are similar, 7.1 tons per person per year. The US emissions are more than double that, 16.4 tons per person per year. Meanwhile, Ethiopia is emitting 0.1 tons per person per year. See the CO2 tracker on the world bank web site. When even the poorest countries like Ethiopia and Bangladesh are doing their best to reduce the small emissions that they have already, the US as one of the top emitters and one of the higher per capita emitters stands out as a country that can do a lot by reducing the CO2 emissions.
Trump's climate skepticism is galvanizing other countries into action - and US cities also
The US has been leading so far. But with Trump as president, it seems the US is going to renounce this lead and go into a back seat, or even, get out of the car altogether, in this analogy, and leave everyone else to drive on without them. It now seems possible that the Trump administration may remain within the Paris agreement, with Trump saying in an interview with the New York Times, “I’m looking at it very closely. I have an open mind to it.”. However it still seems that the Trump administration may dismantle much of the NASA research into climate change. He is also likely to lift restrictions on mining shale, oil, natural gas and clean coal, removing much of the legislation for such businesses, also removing rules for limiting methane emissions from oil and gas industry operations and other legislation. There is a lot he could do to dismantle these provisions, some things he could do unilaterally and others would need co-operation of Congress. See Trump’s First 100 Days: Climate and Energy
Whatever he decides, his rhetoric has had a positive effect, as it has galvanized countries into action, leading them to ratify the treaty in record time and put forward strong initiatives for the future. So paradoxically he may actually have helped with the process of climate mitigation. See also Trump: The best thing ever for climate change? (BBC).
Also many cities and states in the US are convinced of the case for action against global warming. Both right and left wing states are taking measures to combat climate change. Examples of states that are pioneers in this field include California, no surprise, but also Tennessee which has reduced emissions from electricity by 34% since 2005, and Louisiana amongst others. Details here: Trump could reverse 'dramatic' progress on clean energy, experts fear See also this Analysis of 19 states by Georgetown Climate Center showing a “dramatic shift” to clean energy. Either from climate change concerns or economic reasons.
Also the US cities have a fair bit of power for independent action. The major of New York, Michael Bloomberg, in a recent op-ed has said that if the US under the Trump administration does withdraw from the Paris agreement, that he will recommend that the 128 US majors seek to join in its place. They probably can't sign the treaty but they can work together to do their bit to try to ensure that the US achieves its target in the agreement even if the Trump administration does nothing, or withdraws. Many US cities are particularly impacted by climate change predictions, for instance New York with the prospect of future flooding, and Miami with the risks of flooding and hurricane damage. See also this article in Business Insider Mayors could override Trump on the Paris climate accord — here's how
The strong and upbeat MARRAKECH ACTION PROCLAMATION which was signed at the end of the most recent climate change conference, affirms their strong commitment. They declare that they have seen an extraordinary momentum on climate change worldwide and that this momentum is irreversible, and call for further climate action and support well in advance of 2020.
Comments or questions
Whether or not you agree with the views presented here, I hope this has helped to promote understanding of the climate change models, and also to understand why it is no longer a political issue outside the US. Any comments or questions do say. Also do feel free to correct any mistakes you notice in this, however small.
See also my other article on this, President Elect Trump - Why Climate Change Is No Longer A Political Issue Outside The US There is a bit of duplicated content between the two articles. But that one focuses more on the effects and the politics, while this one puts the spotlight more on the models and the climate skeptic arguments.


Comments