


You can’t watch the news, turn on the radio, or open a newspaper these days without hearing about global warming. It seems our future is looking rather warmish, and many of our modern conveniences may be to blame.
I’m not disputing the fact, but at the same time I’ve never had it explained to me precisely and quantitatively how many of the choices I make each day are contributing to global warming. I mean, I understand the link between driving my car and carbon emissions. The family minivan spews carbon dioxide for goodness sake, so I clearly understand how running my daily errands in a gasoline-powered car can contribute to the problem.
But what about the rest of my daily routine… what impact does it have? If I roast a chicken in the crock-pot instead of my electric oven, does is make a difference? What if I grill instead? What is the impact of watering my lawn, or taking a hot shower? How do the decisions I make each and every day impact the environment in terms of energy consumption and greenhouse gas emissions? And what does it mean when we’re told that something produces 100 lbs of CO2 each year? Is that a lot?
I went in search of all of the facts and figures needed to quantify how the little things I do each day translate into fossil fuel usage. I love numbers, formulas, and equations… so I gathered as many as I could find. The effort was worthwhile, because it’s helped me to develop a picture of how many of my short-term decisions have long-term impacts.
If you’re interested in determining what many of the things you do each day relate to this global warming issue we’re hearing so much about… read on! Information is never a bad thing – and once you have it, you are at least armed with additional facts to consider as you go about your day.
APPLES TO APPLES
First, let’s talk units. Global warming is all about an increase in greenhouse gas emissions, which are “thickening” our atmosphere and preventing more and more solar heat from escaping. The greenhouse gas we hear the most about is carbon dioxide, because it is what we see the largest quantities of, and is what has been increasing so dramatically over the past 50 years. There are other greenhouse gases that are also on the rise, but initially we’ll concentrate on carbon dioxide.
As we go about our day, we do things that directly contribute to greenhouse gas emissions (like driving our cars), and indirectly contribute (like using electricity that is produced by burning fossil fuels, which generates carbon dioxide). To compare the impact of it all, we will look at everything in terms of the pounds of CO2 that are produced as a result of our activities and energy consumption.
GASOLINE
Let’s start with the most direct contributor first: automobile emissions. According to the EPA, a gallon of gasoline produces 19.4 pounds (or 8.8 kilograms) of CO2. (1)  This of course is an average, and takes into account the total number of cars on the road, the average fuel economy of these cars, and the total annual emmissions due to cars. Our personal cars may be a little more or a little less, but this gives us a general idea.
In our family, our minivan gets an average of 20 mpg. So for each individual mile we burn approximately 1/20th or 0.05 gallons. So, using the approximation above, that equates to 0.97 lbs of CO2 per mile… almost one pound per mile.
So those drizzily mornings when I drive my daughter the 5-mile round trip to drop her off at her middle school instead of letting her take the bus, I burn up about a quarter of a gallon of gas, and produce 4.85 pounds of CO2. In actuality, it is probably a little more, because cars are least efficient during the first few miles of the day while the engine is still cold. My car is probably just warming up to its peak efficiency just as I’m returning to the garage.
Hmmm… maybe it’s time to invest in an umbrella.
ELECTRICITY
When you receive your electrical bill each month, your usage is most likely presented in terms of kilowatt-hours (kWh).  A kilowatt-hour is a unit of energy equivalent to 1000 watts of electricity used for 1 hour. So for example, if you left a 100 watt light bulb on for one hour, you would use (100 watts) x (1 kW/1000 watts) x (1 hour) = 0.10 kWh.
The national average emissions factor for electricity is 1.37 pounds CO2 per kWh. (2) Again, this is an average. Different sources of electricity clearly produce different levels of emissions. Burning coal and natural gas are on the high end, while solar power and wind power are considered to be “green” or renewable sources that do not contribute to greenhouse emissions at all.
If you are interested in discovering specifically what sources are used for electricity in your area, your can contact your utility company and find out. In California, utility companies provide a Power Content Label (3) which gives a breakdown of what percentage of the power they supply comes from various energy resources. But for now, we’ll use the national average above.
So how do you determine how much energy you’re using, and therefore how much CO2 you are emitting, as you putter around your home each day? Well, most appliances come with an Energy Guide label that gives an estimation of what the energy use of that appliance is in terms of kWh per year. But if you really want to know specifically what’s going on in your home, you need to find out what the wattage of the appliances you use, and determine the number of hours per day that you use them.
Unlike lightbulbs, not everything is stamped with its wattage information. If you’re really a hands-on kind of person, you can still estimate it by finding the current draw (in amperes) and multiplying that by the voltage used by the appliance. Most appliances in the United States use 120 volts. Larger appliances, such as clothes dryers and electric stoves, use 240 volts. The amperes might be stamped on the unit in place of the wattage. If not, find a clamp-on ammeter—an electrician's tool that clamps around one of the two wires on the appliance — to measure the current flowing through it. You can obtain this type of ammeter in stores that sell electrical and electronic equipment. Take a reading while the device is running; this is the actual amount of current being used at that instant. (4)
If you don’t feel like getting down to that level of nitty-gritty, there are plenty of tables available that will provide an estimated wattage rating for major appliances. To help me answer the question about using my crock-pot instead of my oven to roast a chicken for example, I looked up the estimated wattage of the two appliances so I could compare.
According to my source (5), the wattage of an electric oven is approximately 4000 W, while a crock-pot uses approximately 250 W. So, I can roast a chicken for 2 hours in the oven, or for 5 hours in the crock-pot. Does it make a big difference? Let’s see:
Oven: (4000 W) x (1 kW/1000 W) x (2 hours) = 8 kWh
Crock-pot: (250 W) x (1 kW/1000 W) x (5 hours) = 1.25 kWh
Now, like many appliances, ovens and crock-pots aren’t “on” the entire time they are being used. They heat up to the temperature required, and then cycle on and off as many times as are needed to maintain that temperature. What percentage of time are they off? I actually don’t know, and it is dependent on many factors (including how many times you open the oven door or lift the lid of the crock-pot to check on your meal). But let’s assume over a period of time, our cooking appliances are actually on for 70% of the time. (This is a guess folks, completely off the top of my head. If anyone has any real figures on this – please let me know!)
Back to our chicken. If we reduce our calculations by 30%, we have comparative figures for our two appliances of:
Oven: 5.6 kWh at 1.37 pounds CO2 per kWh corresponds to 7.67 lbs of CO2
Crock-pot: 0.875 kWh at 1.37 pounds CO2 per kWh corresponds to 1.20 lbs of CO2
So, by roasting a chicken in the crock-pot, I can save approximately 4.7 kWh, and avoid corresponding emissions of approximately 6.4 lbs of CO2. Not to mention avoid heating up my kitchen by using the oven, which impacts another energy hungry beast in my house – the air conditioner. Nice!
COOKING WITH GAS
For those that would rather sauté their chicken on the stove, or throw it on the barbeque, there are conversion factors to calculate CO2 emissions from the use of natural gas and propane as well. 
If you get a bill each month for natural gas, most likely it is going to display your gas usage in terms of therms. One therm is equivalent to 100,000 BTU, and one therm of natural gas generates 11.7 pounds of CO2 (6). To determine your energy usage and corresponding emissions from using your gas stove, you first need to discover your stove’s BTU input rate. Most major gas appliances have a fuel rating plate attached to them that will tell you its hourly BTU input. But just as with electrical appliances, if you cannot find the specific information on your appliances, there are several tables available that can help you estimate the values.
The estimated energy usage for a gas stovetop is 9000 BTUs/hr (7). So if you decide to make a nice chicken sauté, a half-hour of cook time on the stove would equate to:
(9000 BTU/hr) x (.5 hr) x (1 therm/100,000 BTU) x (11.7 lbs CO2/therm) = 0.53 lbs CO2
What if you like to grill? During the summer months, there’s not much that can beat a great meal prepared on the BBQ. But what is the impact to using a propane-fueled grill? Well, the conversion factor for propane is 1 gallon of propane generates 11 pounds of CO2 (7). But to determine how quickly your grill burns through a gallon of propane, you will once again need to have an idea of what the BTU rating is for your particular grill.
Generally you will find that the BTU rating of most grills is approximately 10,000 BTU per the number of burners. So if you have a 4-burner grill, you’re looking at a grill in the neighborhood of 40,000 BTUs/hr. Now given the amount of technical data available on most grills (to compare against the neighbors’, of course), you may know exactly what the BTU rating is for your 6-burner-with-rotisserie-and-smoker stainless steel behemoth. But if the particulars have slipped your mind, you can use the 10,000 BTU/burner rule.
So to determine the propane used (and CO2 generated) when you throw some chicken on the grill, the last piece of information you will need to know is that each gallon of propane is equivalent to 91,502 BTU (8). Given that, what does the math tell us is the result of a half-hour of grilling on our Weber 4-burner?
(40,000 BTU/hr) x (0.5 hr) x (1 gal/91,502 BTU) x (11 lbs CO2/gal) = 2.40 lbs CO2
And what if you decide to use a charcoal grill instead of propane? A charcoal grill operated for an hour will emit approximately 11 pounds of carbon dioxide (9). And unlike a gas grill, it cannot be turned off once you pull your meat off. So although there are certainly flavor benefits to cooking over a smoky grill, if your concern this 4th of July is reducing your environmental impact, then propane is the way to go.
WATER
It’s easy to miss the link between water usage and carbon emissions. Water of course is not a source of greenhouse gas itself, but the electricity required to transport, treat, and distribute it certainly is!
According to the CEC (10), the typical energy use for urban drinking water supply is comprised of the following segments:
Conveyance: Average energy use – 100 kWh/MG
Treatment: Average energy use – 250 kWh/MG
Distribution: Average energy use – 1,150 kWh/MG
When you add it all together, on average it takes 1,450 kWh per Million Gallons (MG) to deliver clean water to our homes.
So how much water do we use during our typical daily activities? Well, let’s begin with our daily shower.  A conventional showerhead uses 3-5 gallons of water per minute. However, federal regulations mandate that new showerhead flow rates can’t exceed more than 2.5 gpm (at a water pressure of 80 psi). To determine the impact of the water used by each option, we’ll do the math for a ten-minute shower for both:
Conventional Showerhead (Avg. 4 gpm)
(4 gal/min) x (10 min) x (1 MG/ 1,000,000 gal) x (1450 kWh/MG) = 0.058 kWh
Low-Flow Showerhead (2.5 gpm)
(2.5 gal/min) x (10 min) x (1 MG/ 1,000,000 gal) x (1450 kWh/MG) = 0.036 kWh
Then using our previously discovered conversion to CO2 for electricity:
Conventional: (0.058 kWh) x (1.37 lb CO2/kWh) = 0.079 lbs CO2
Low-Flow: (0.036 kWh) x (1.37 lb CO2/kWh) = 0.049 lbs CO2
So one shower by itself doesn’t have a huge impact, regardless of the showerhead used. But not many of us out there are happy to stop at one shower for a lifetime. Let’s assume we take 6 showers a week (maybe we take Saturday off?), every week, each year.
Conventional: (0.079 lbs CO2) x (6 days/week) x (52 weeks/yr) = 24.65 lbs CO2/year
Low-Flow: (0.049 lbs CO2) x (6 days/week) x (52 weeks/yr) = 15.28 lbs CO2/year
And how many people are in your household (hopefully) taking showers on a regular basis? If you are a family of four, with each person taking the equivalent of 6 ten-minute showers per week:
Conventional: (24.65 lbs CO2/year) x 4 = 98.60 CO2/year
Low-Flow: (15.28 lbs CO2/year) x 4 = 61.12 CO2/year
What about other daily uses of water? Where we live, the lawn must be watered just about daily if we want our grass to remain anything close to green during the summer months. So how much water and electricity is being used each morning when we hear the sprinklers kick on, and what is the impact?
To determine the gallons of water that are used during your daily watering cycle, calculate the gallons per minute (gpm) used by each zone of your sprinkler system.  To accomplish this, add up the gpm output of each sprinkler head in each zone. The data for each spinkler nozzle can be obtained from the manufacture, and many nozzles have the gpm figure stamped or molded right on them. Generally however, spray heads use about 0.75 gpm for ¼-circle, 1.5 gpm for ½-circle, and 3.0 gpm for full-circle heads. “Rotor” style heads use 2 to 5 gpm each, for most residential applications (11). After determining the gpm for each zone, multiply it by the time that zone is on each morning, and then add all the zones together to find out what your total water usage is for each watering cycle.
Here’s an example. Let’s say that after a quick look over your front and back lawns, you determined that you had the equivalent of 20 “full-circle” heads in your entire system. Also each of your zones is set to water for the same amount of time each morning, 12 minutes. Skipping a step or two, you can just multiply out the total gpm, and the resulting water usage, for the whole system.
(20 sprinklers) x (3.0 gpm/sprinkler) x (12 min/day) = 720 gallons/day
This equates to:
(720 gallons/day) x (1 MG/ 1,000,000 gal) x (1450 kWh/MG) = 1.044 kWh/day
(1.044 kWh/day) x (1.37 lb CO2/kWh) = 1.43 lb CO2/day
Assuming the sprinklers run 5 mornings a week through the 13 weeks of summer:
(1.43 lb CO2/day) x (5 days/week) x (13 weeks) = 92.95 lbs CO2
So in this case, just running the sprinklers through the summer uses almost the same amount of resources and has the same impact of a family of four showering for an entire year!
THE CARBON COMPONENT
All of our equations have helped us to quantify the amount of carbon dioxide that is emitted into the atmosphere as a result of the electricity, water, natural gas and gasoline that we use. But how much is too much? And what do these pounds of carbon dioxide mean in terms of something we can better understand?
Natural components or our earth’s ecosystem are doing their best to offset the carbon dioxide produced each year. The oceans, trees, plants, and soil have the natural ability to absorb carbon dioxide through photosynthesis – the process through which plants and trees convert water, sun, and carbon dioxide into fuel and nutrients, while producing oxygen as a byproduct. As efficient as these natural “carbon sinks” are however, they can no longer keep up with the accelerated rate that carbon dioxide is being released through the use and burning of fossil fuels.
Of the approximately 8 billion tons of carbon emitted each year, scientists believe about 30 percent is absorbed by the oceans, and about 30 percent is absorbed by terrestrial ecosystems, especially trees. The remaining 40 percent however, accumulates in the atmosphere (12).  This percentage may be increasing though, as recent studies have discovered that some of our oceans are already saturated with carbon dioxide. Researchers say at least one large ocean, the Southern Ocean around Antarctica, is so loaded with CO2 that it's losing its ability to soak it up. The Southern Ocean alone accounts for 15 percent of the global carbon sink. The decline of Antarctica's Southern Ocean as a carbon sink may raise future CO2 levels and speed up global warming. Climate scientists have predicted this would happen. The trouble is that the changes appear to be happening some 40 years ahead of schedule (13).
So if over time, the oceans begin to max-out on their carbon absorption capabilities, our only remaining natural resource to counterbalance growing carbon dioxide emissions is plant life… especially trees. But how many trees does it take to absorb the CO2 that is being emitted as a result of our daily activities?
Different trees absorb CO2 at different rates.  As an example, let’s take one that we’re all familiar with (especially around Christmas time), the Douglas fir. Through photosynthesis, trees remove CO2 from the atmosphere and store the carbon within the components that make up wood tissue. An acre of Douglas fir trees stores approximately 1.4 metric tons of carbon each year (14). To equate this to pounds of CO2 removed from the atmosphere, we need to multiply this figure by the ratio of the molecular weight of carbon dioxide to that of carbon (44/12), and the ratio of pounds per metric tons (2203/1).
(1.4 MT C/acre) x (44 units CO2 / 12 units C) x (2203 lbs/MT) = 11,308.7 lbs CO2
Each year, an acre of Douglas fir trees can absorb 11,308.7 lbs of carbon dioxide.
But what about just one tree?  Not all of us have acres available to devote to a Christmas tree farm. However, for the beauty factor alone I love to have trees throughout my yard. Besides providing shade in the hot summer, can a tree planted in the suburbs make a difference in offsetting carbon emissions?
A medium growth coniferous (evergreen) tree, planted in an urban setting and allowed to grow for 10 years, sequesters 23.2 lbs of carbon (14). This estimate assumes the trees are planted when they are approximately 4.5 feet tall (the typical size of tree purchased in a 15-gallon container). Once again, we need to convert this estimate to pounds of CO2 removed from the atmosphere.
(23.2 lbs C) x (44 units CO2 / 12 units C) = 85.1 pounds of CO2
A medium growth evergreen tree, planted in an urban setting and allowed to grow for 10 years, absorbs approximately 85 pounds of carbon dioxide.
So every tree can make a difference, but clearly there is a vast difference in scale in terms of how quickly CO2 can be released into the atmosphere compared to how long it would take for that same amount to be absorbed naturally. For example, it would take a single tree 10 years to absorb the carbon dioxide emitted in less than 90 minutes by a typical car driving on the freeway.
For further illustration, here are some additional “weekly activities” and what they equate to after a month in terms of energy consumption, CO2 emissions, and equivalent fossil fuel use. Also included is the number of evergreen tree seedlings that would need to be planted (and left to grow for 10 years) to offset the resulting emissions.
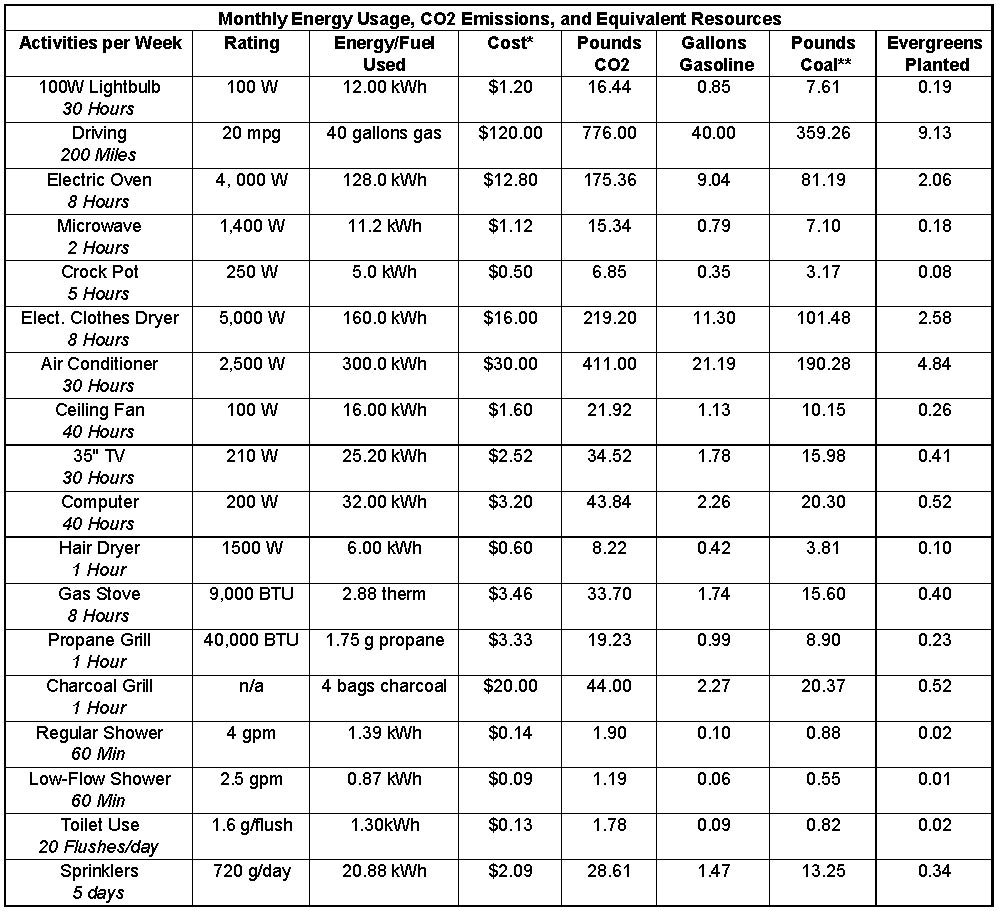
* Monthly costs are based on: $0.10 per kWh, $3.00 per gallon for gasoline, $1.20 per therm for natural gas, $1.90 per gallon for propane, and $5.00 per 10 lb. bag of charcoal.
** Coal emissions were estimated by averaging the carbon coefficients for bituminous and sub-bituminous categories of coal, which make up over 90% of the coal used in the U.S. (15)
SO WHAT DOES IT ALL MEAN?
The topic of global warming is a controversial one. There are as many people confident that the temperature increases we are experiencing are part of a natural cycle, as there are people that are convinced that it is the beginning of a steep incline like nothing we’ve seen before. Despite where the truth lies, there is no dispute that most of the things we do as part of our daily industrialized life result in significant carbon emissions into our atmosphere.
What started for me as mere curiosity, has resulted in the discovery that as a single individual my impact on this planet is much larger than I would have guessed. It was eye-opening, and surprising – and definitely has made me fold some additional factors into my every-day decision making. Now instead of making choices based solely on what are the easiest and fastest options, I think also of the long-term impacts.
As I said before, information is never a bad thing. And the more we have in our own back pocket, the less we need to rely on others to feed it to us - either with or without their own personal spin.
There's a lot of information here, but still one question that hasn't been answered yet. How do you roast a chicken in a crock-pot?
Well, I'm glad you asked...
GOTTA GO GREEN - CHICKEN IN A POT
1 cup baby carrots
4-6 small red potatoes - halved
1 onion - sliced
4-5 lb. whole chicken
2 tsp. garlic salt
1/2 tsp. coarse black pepper
1 tsp. dried basil
1 tsp. poultry seasoning
1/2 cup water, chicken broth, or white wine
Place vegetables in bottom of crock-pot. Place chicken on top of vegetables. Add seasonings and water/broth/wine.
Cover. Cook on low 8-10 hours, or High 4-5 hours, until juice runs clear from chicken. (use 1 cup liquid of cooking on High)
Makes 6 servings.
Enjoy!
(1) http://www.epa.gov/otaq/climate/420f05004.htm
(2) http://www.epa.gov/climatechange/emissions/ind_assumptions.html
(3) http://www.energy.ca.gov/consumer/power_content_label.html
(4) http://www.oru.com/energyandsafety/energyefficiency/calculatingenergyuse.html
(5) http://www.powerhousetv.com/stellent2/groups/public/documents/pub/phtv_000296.pdf
(6) http://revelle.net/lakeside/lakeside.new/understanding.html
(7) http://www.wisconsinpublicservice.com/home/appcalc_gas.asp
(8) http://www.coxontool.com/index.php/Airstream/Propane
(9) http://www.ornl.gov/info/press_releases/get_press_release.cfm?ReleaseNumber=mr20030703-00
(10) http://www.solar2006.org/presentations/forums/f23-cooney.pdf
(11) http://www.rainbird.com/landscape/technical/articles/scheduling.htm
(12) http://www.science20.com/news/bad_for_carbon_offsets_not_all_trees_are_the_same_at_reducing_global_warming
(13) http://www.spiegel.de/international/world/0,1518,483540,00.html
(14) http://www.usctcgateway.net/tool/
(15) http://www.eia.doe.gov/oiaf/1605/coefficients.html/


Comments