

[The article below is courtesy Eilam Gross. Eilam is a physicist from the ATLAS experiment and has been convener of the Higgs group there. I am very happy to host a guest post from him on the exciting topic below...]
It’s been three years since the discovery of the Higgs Boson with the Large Hadron Collider (LHC) in Geneva. Two beams of protons are accelerated to speeds approaching the speed of light and colliding with energy densities similar to those existed fractions of a second after the big bang. The discovery of the Higgs Boson filled in the last vacancy in the Standard Model puzzle. All the particles predicted by the Standard Model have been discovered, including photons, electrons, neutrinos and quarks. Alas, this seemingly complete puzzle has not made Physicists happy. Its foundations seem not to be on a solid ground. The model does not predict the masses of matter particles, and we do not understand the hierarchy of the particle masses, i.e. why some of them are so much heavier than others with unnatural differences.
Physicists invented models that extend the Standard Model and sort out some of its problems. These models, such as Supersymmetry, contain more particles, most of them very heavy. Experimentalists turned their attention to the search for heavy particles (including heavier Higgs bosons). However, to discover heavy particle you need to produce them. And to produce heavy particles one must collide the protons with higher energies. Indeed, after the Higgs discovery, the collision energy was doubled to 13 TeV, i.e. 13,000 times the mass of the proton.
Physicists hoped to observe a new heavy particle that is predicted by one of their many models. But none expected to see the unexpected… A particle that no existing model predicts as is. This might be the reason that physicists find it hard to digest the new observation and play it as low as possible to reduce the expectations.
There is also a firm scientific basis to the lowering of the expectations and it is scientifically called: “The Look Elsewhere Effect”.
When we discovered the Higgs boson, nobody was surprised. The Standard Model predicted it, and we were expecting it. And the Higgs appeared with its full glory. Particles like the Higgs have a very short life time, after which they decay and transform themselves into other particles. The Higgs has plenty of decay modes, and it manifested itself in most of them, such has four electrons, two photons and many more.
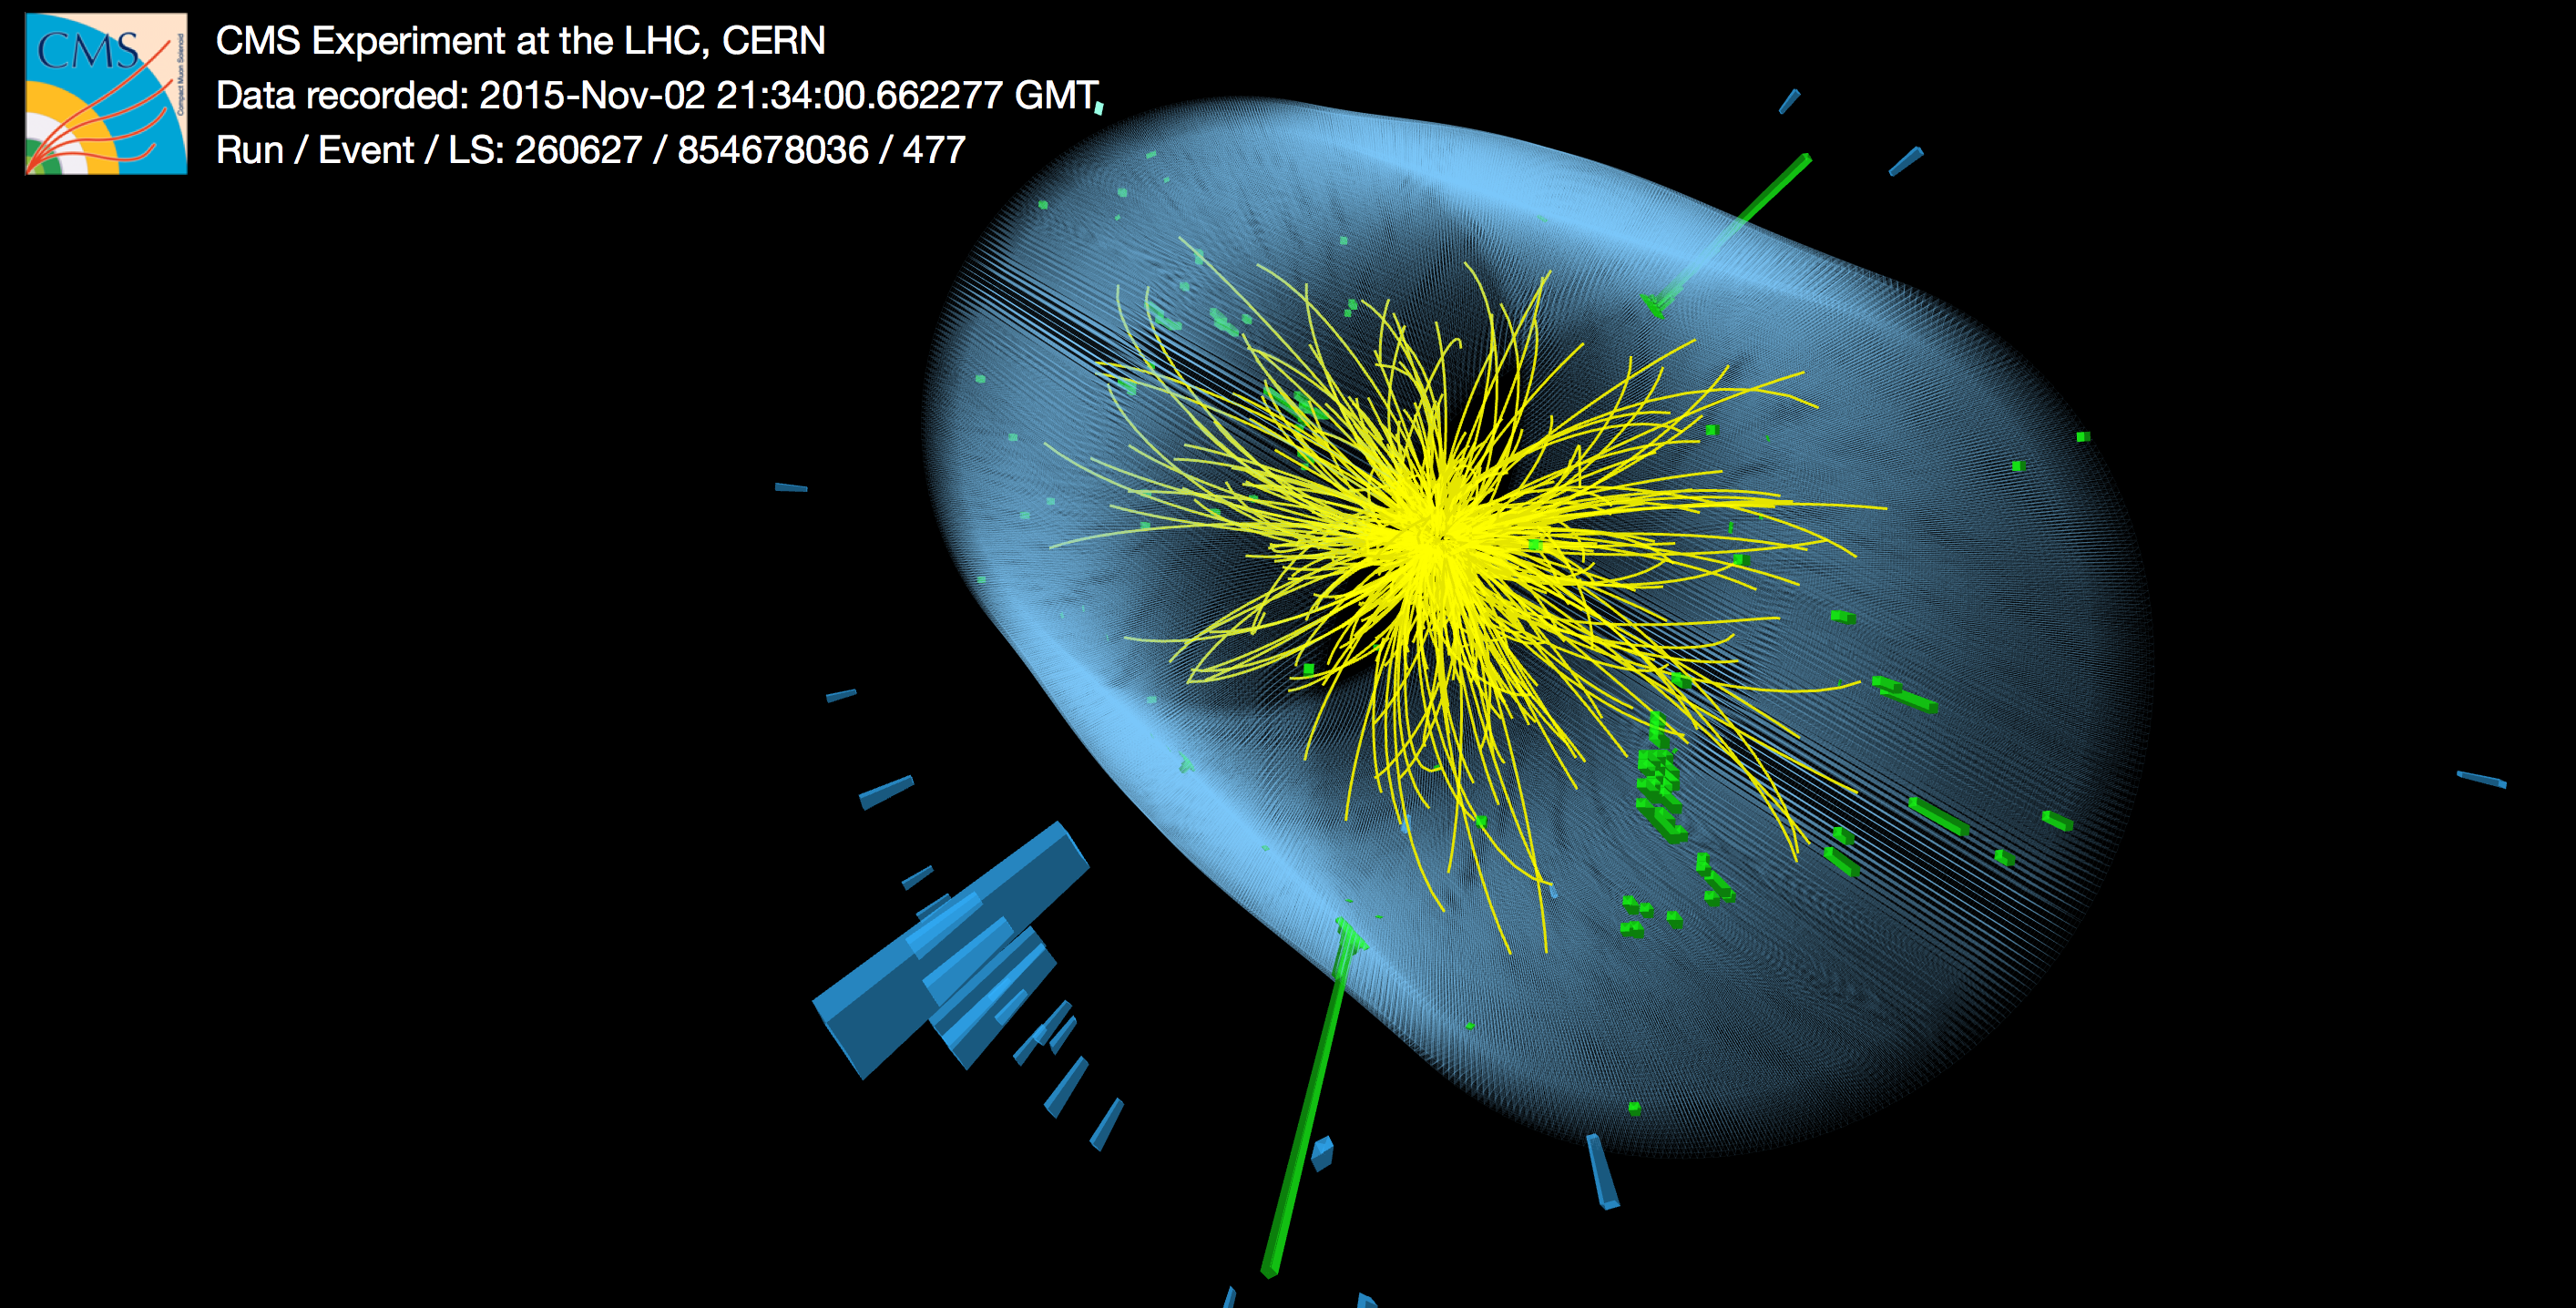
Figure 1 shows one of the events which has generated the ongoing buzz. When one interprets the diphoton, i.e. the two photons (green lines) as the remnants of a decay of a heavier particle, one gets that the mass of that particle is 750 GeV, which means, six times heavier than the Higgs boson. Had we seen only one particle like this, we wouldn’t have got excited. The Standard Model is predicting the existence of many collision events with diphoton masses in that vicinity. However, we get many more, many more than predicted by the Standard Model. So the only remaining question is how many more one needs to observe in order to summon a press conference. The answer is given using a statistical term called significance. A Significance is measured and expressed by the number of standard deviations.
Let us illustrate it with an example. A quick search in google reveals that the average height of the American man is 177 cm with a standard deviation of 8 cm, which means, that about 2/3 of the American male population are between 169-185 cm tall. Michael Jordan, however, is not in this range. He is 198 cm. This means that his height is almost three standard deviations above the average. Less than a quarter of a percent of the men in the USA are as high as Michael Jordan or more. Shaquille O’neal is even taller. He is 216 cm, five standard deviations above the average. Only about 30 men, out of 170 million American men are as tall as this or taller. Which means that the probability that a random American man will be as tall is less than one in a million. No doubt that being five standard deviations above the average is extraordinary and draws attention. There is no known American man who is six standard deviations above the average height. If you see one like this walking down the street, you will plausibly think its and alien, and would probably be right…
No wonder there is a tradition amongst physicists that if in a collision, the number of observed events with some specific mass, exceed that of the exception by more than five standard deviations, this is probably not a result of a statistical fluctuation of the expected known physical processes, but a newly discovered particle. Five sigma, or 5 standard deviations, is the magic number used by physicists to declare a discovery. Both LHC experiments, ATLAS and CMS, reported in July 2012, an excess of events with a mass of 125 GeV exceeding the five sigma expectation. They observed it in two decay modes, one of which was diphotons. The probability of a mistake in each of the experiment was less than one in a million. By a mistake, we mean that the observation IS a statistical fluctuation and not a newly discovered particle. Since both experiments observed it at the same mass, the confidence in the result was strong enough to allow the CERN Director General Rolf Heuer to say his famous words: “As a layman I would say, I think we have it”, in other words, the Higgs boson has been discovered.
In seminars given in Geneva on Tuesday 14 Dec 2015, both ATLAS and CMS reported an excess of diphoton events with a mass of 750 GeV ( 6 times heavier than the Higgs boson).
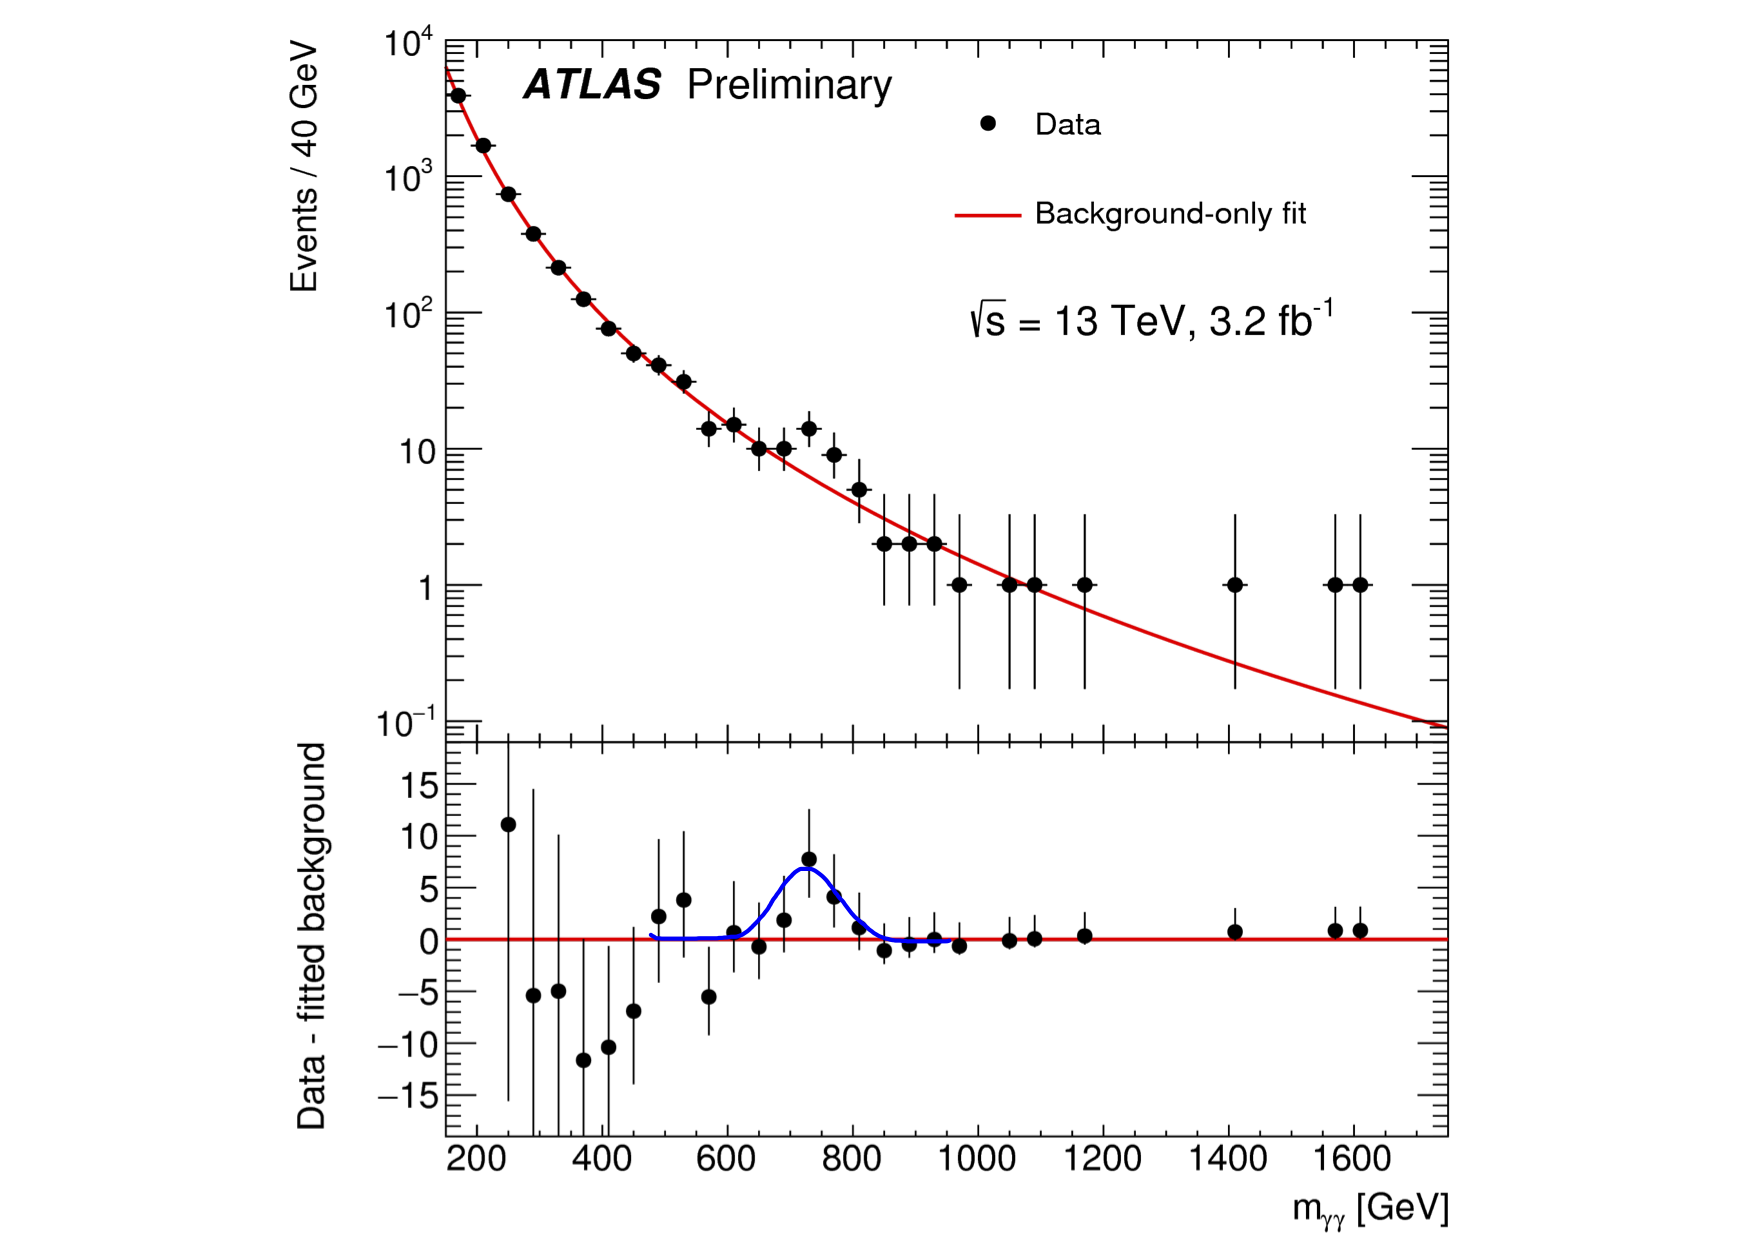
Figure Figure 2 shows the distribution of the mass of diphoton events recorded by the ATLAS experiments during 2015. We see there events with all possible masses from 200-1600 GeV. The red curve in the top part of the plot indicates the expectation from the Standard Model. In some masses, we see an excess of events and in some a deficit on the Standard Model expectation. The excess or deficit is shown in the bottom part of the plot. One clearly sees an unusual clustering of excessed events in the vicinity of 750 GeV. This clustering creates a bump in the shape of a bell. To guide the eye, I plotted a blue bell (bottom of Figure 2) which does not exist in the original plot from ATLAS. If one try to match the bell to the excess of events and count the events inside the bell, one gets that there are about 15 events on top of about 15 expected events (a total of about 30 events). The probability of a statistical fluctuation of the expected 15 events to give over 30 events is less than 1:10000, and is equivalent to an almost, four sigma deviation from the expectation. In our American male population example, four sigmas would be a man with a height exceeding 209 cm, given the average is 177 cm with a standard deviation of 8 cm.
Less than 1:10000 is a very low probability or, alternatively, very high significance. So why didn’t ATLAS get excited and call for an urgent press conference?
We will discuss it now.
Note that in
the bottom part of Figure 2 there is an excess of events in other masses, not
only 750 GeV, There is an excess at 500,1400, 1600 GeV.
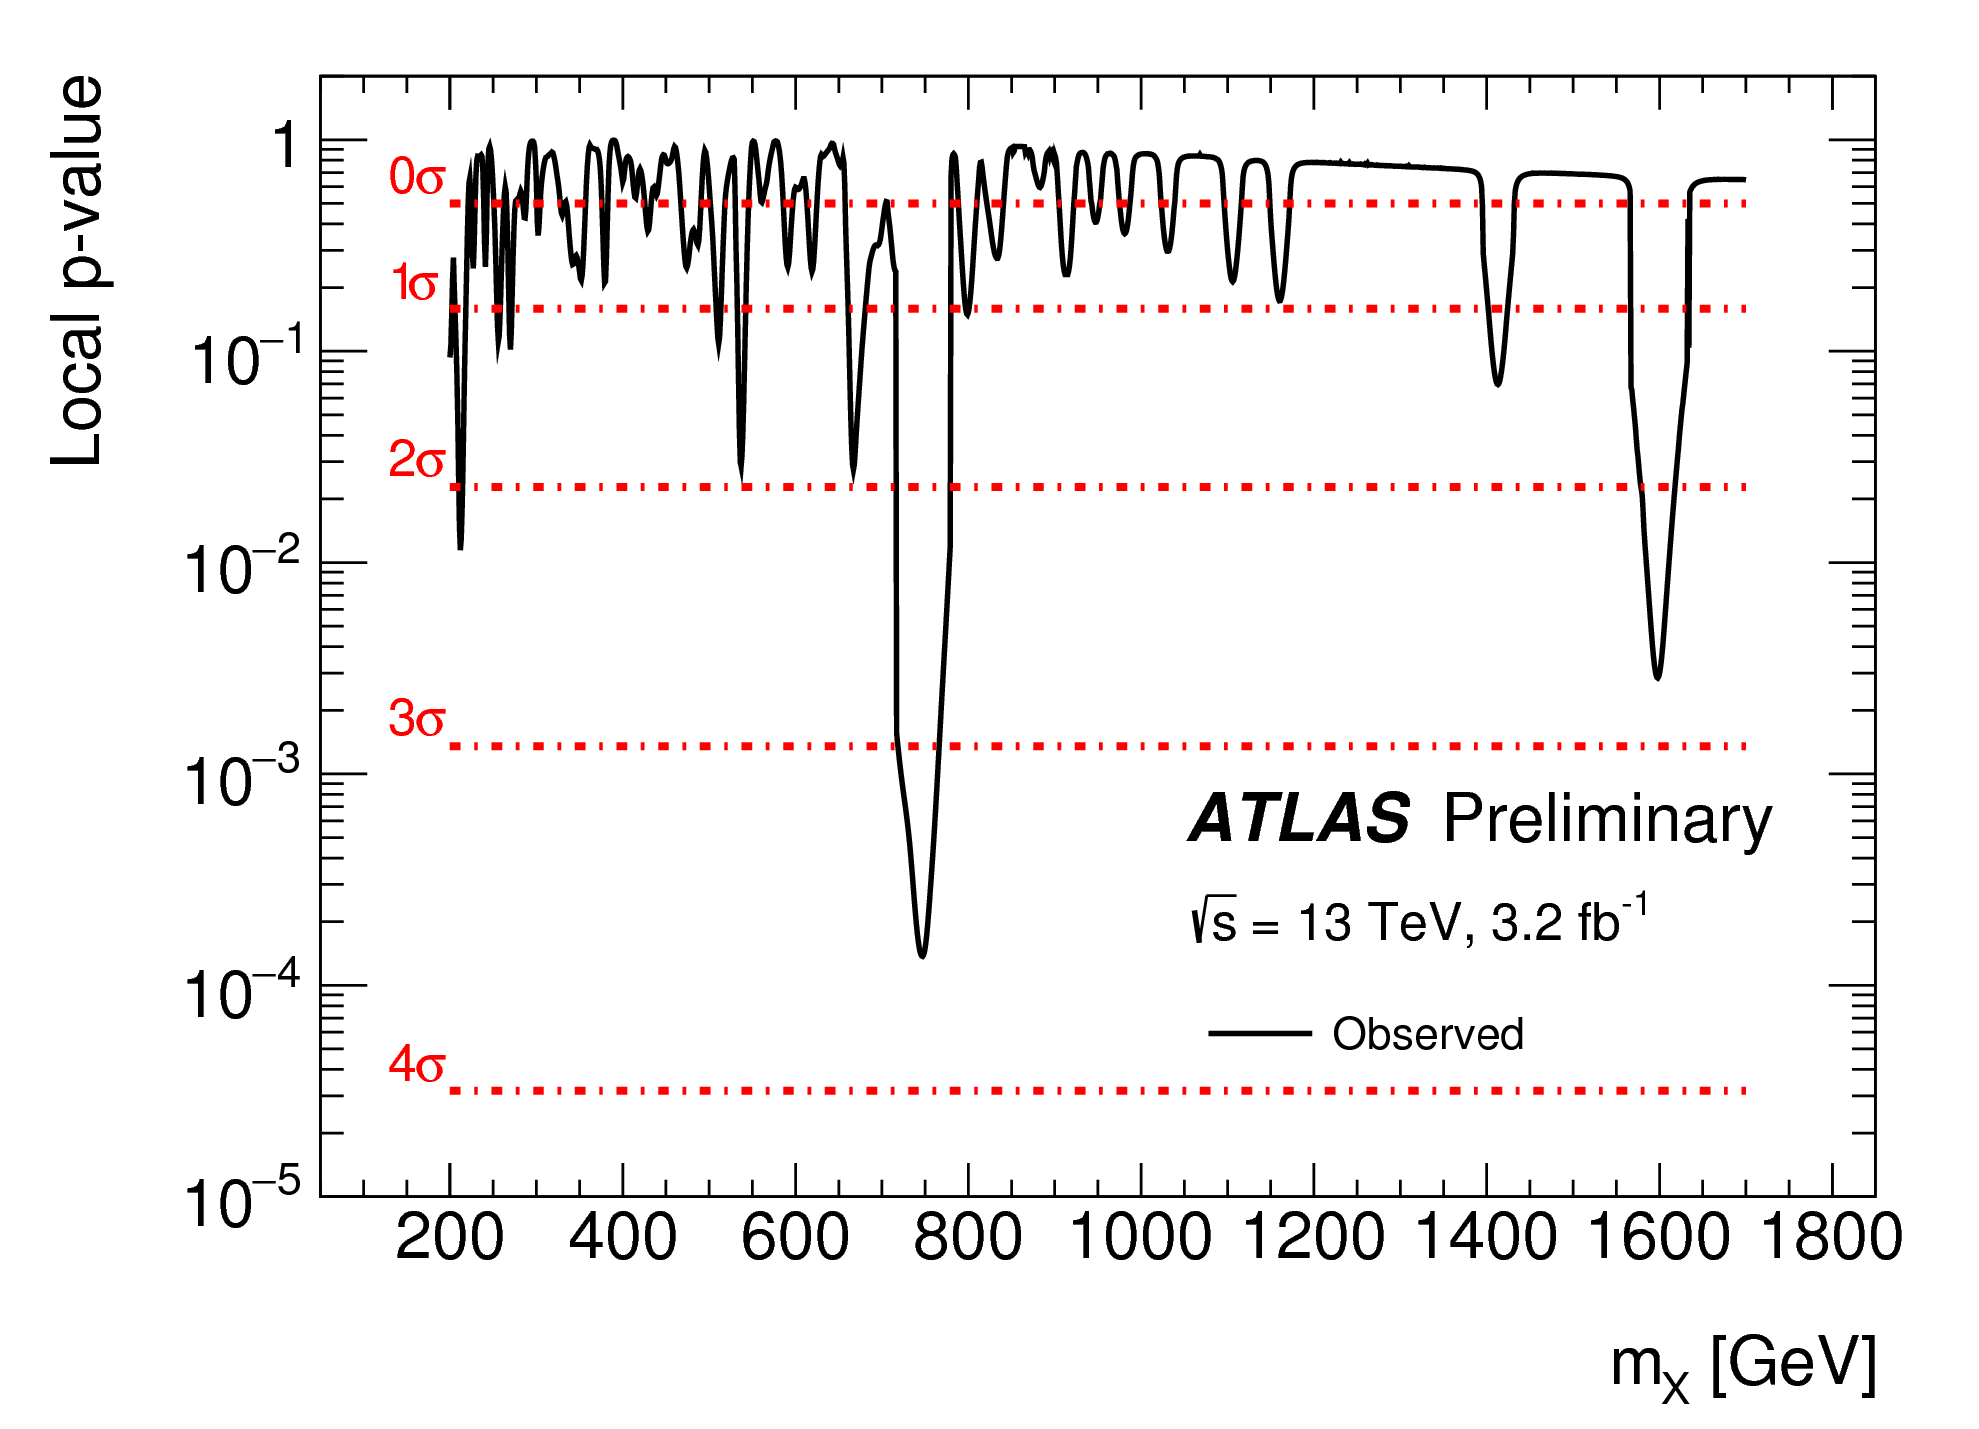
Figure 3 shows the probability that the fluctuation we observe in a specific mass is a result of a fluctuation of the Standard Model. One clearly sees that the smallest probability occurs at 750 GeV. The lower the probability for a fluctuation is, the higher is the significance, and it becomes more plausible to speculate a new particle, i.e., the excess is not a fluctuation but a result of new physics. At a mass of 750 GeV we see a four sigma excess, but there is also an excess at the level of 3 sigmas at a mass of 1600 GeV. The plot shows many statistical fluctuations. It turns out statistical fluctuations are a matter of routine, and one has to take a lot of precaution before declaring that a significant excess is not a fluctuation but evidence for a new particle.
When we said that the probability to see a statistical fluctuation around a mass of 750 GeV is less than 1:10000, we answered the following question: “What is the probability that the expectation of 15 events with a definite mass of 750 GeV, will fluctuate to give over 30 events at that mass?”.
Here we require investing some more thought. Had we seen such am excess at any other mass (not necessarily 750 GeV), we would have also cried “wolf, wolf”. It would have drawn our attention in the same manner. Had we seen it in 200, 300, 600, 1000, any other mass. There is nothing special a-priori in 750 GeV. This means that we have not answered the right question. We should have asked: “What is the probability of seeing an excess exceeding 4 sigma ANYWHERE in the search mass range”. This probability is certainly bigger than the probability to see the excess at exactly 750 GeV. Higher probability leads to a notable reduction of significance.
This effect of degrading significance as a result of pausing a different question, of looking everywhere in the search range, is called, “the Look Elsewhere Effect (LEE)”. Its calculation is very complicated but formulas that are easy to use were derived. The LEE can also be extended to more than one variable in action. For example, we can extend the question and ask, “ What is the probability of seeing an excess exceeding 4 sigma with any mass and bell width in the search mass-width range?”. This probability would even be higher. The effect is called, “the multidimensional LEE”.
|
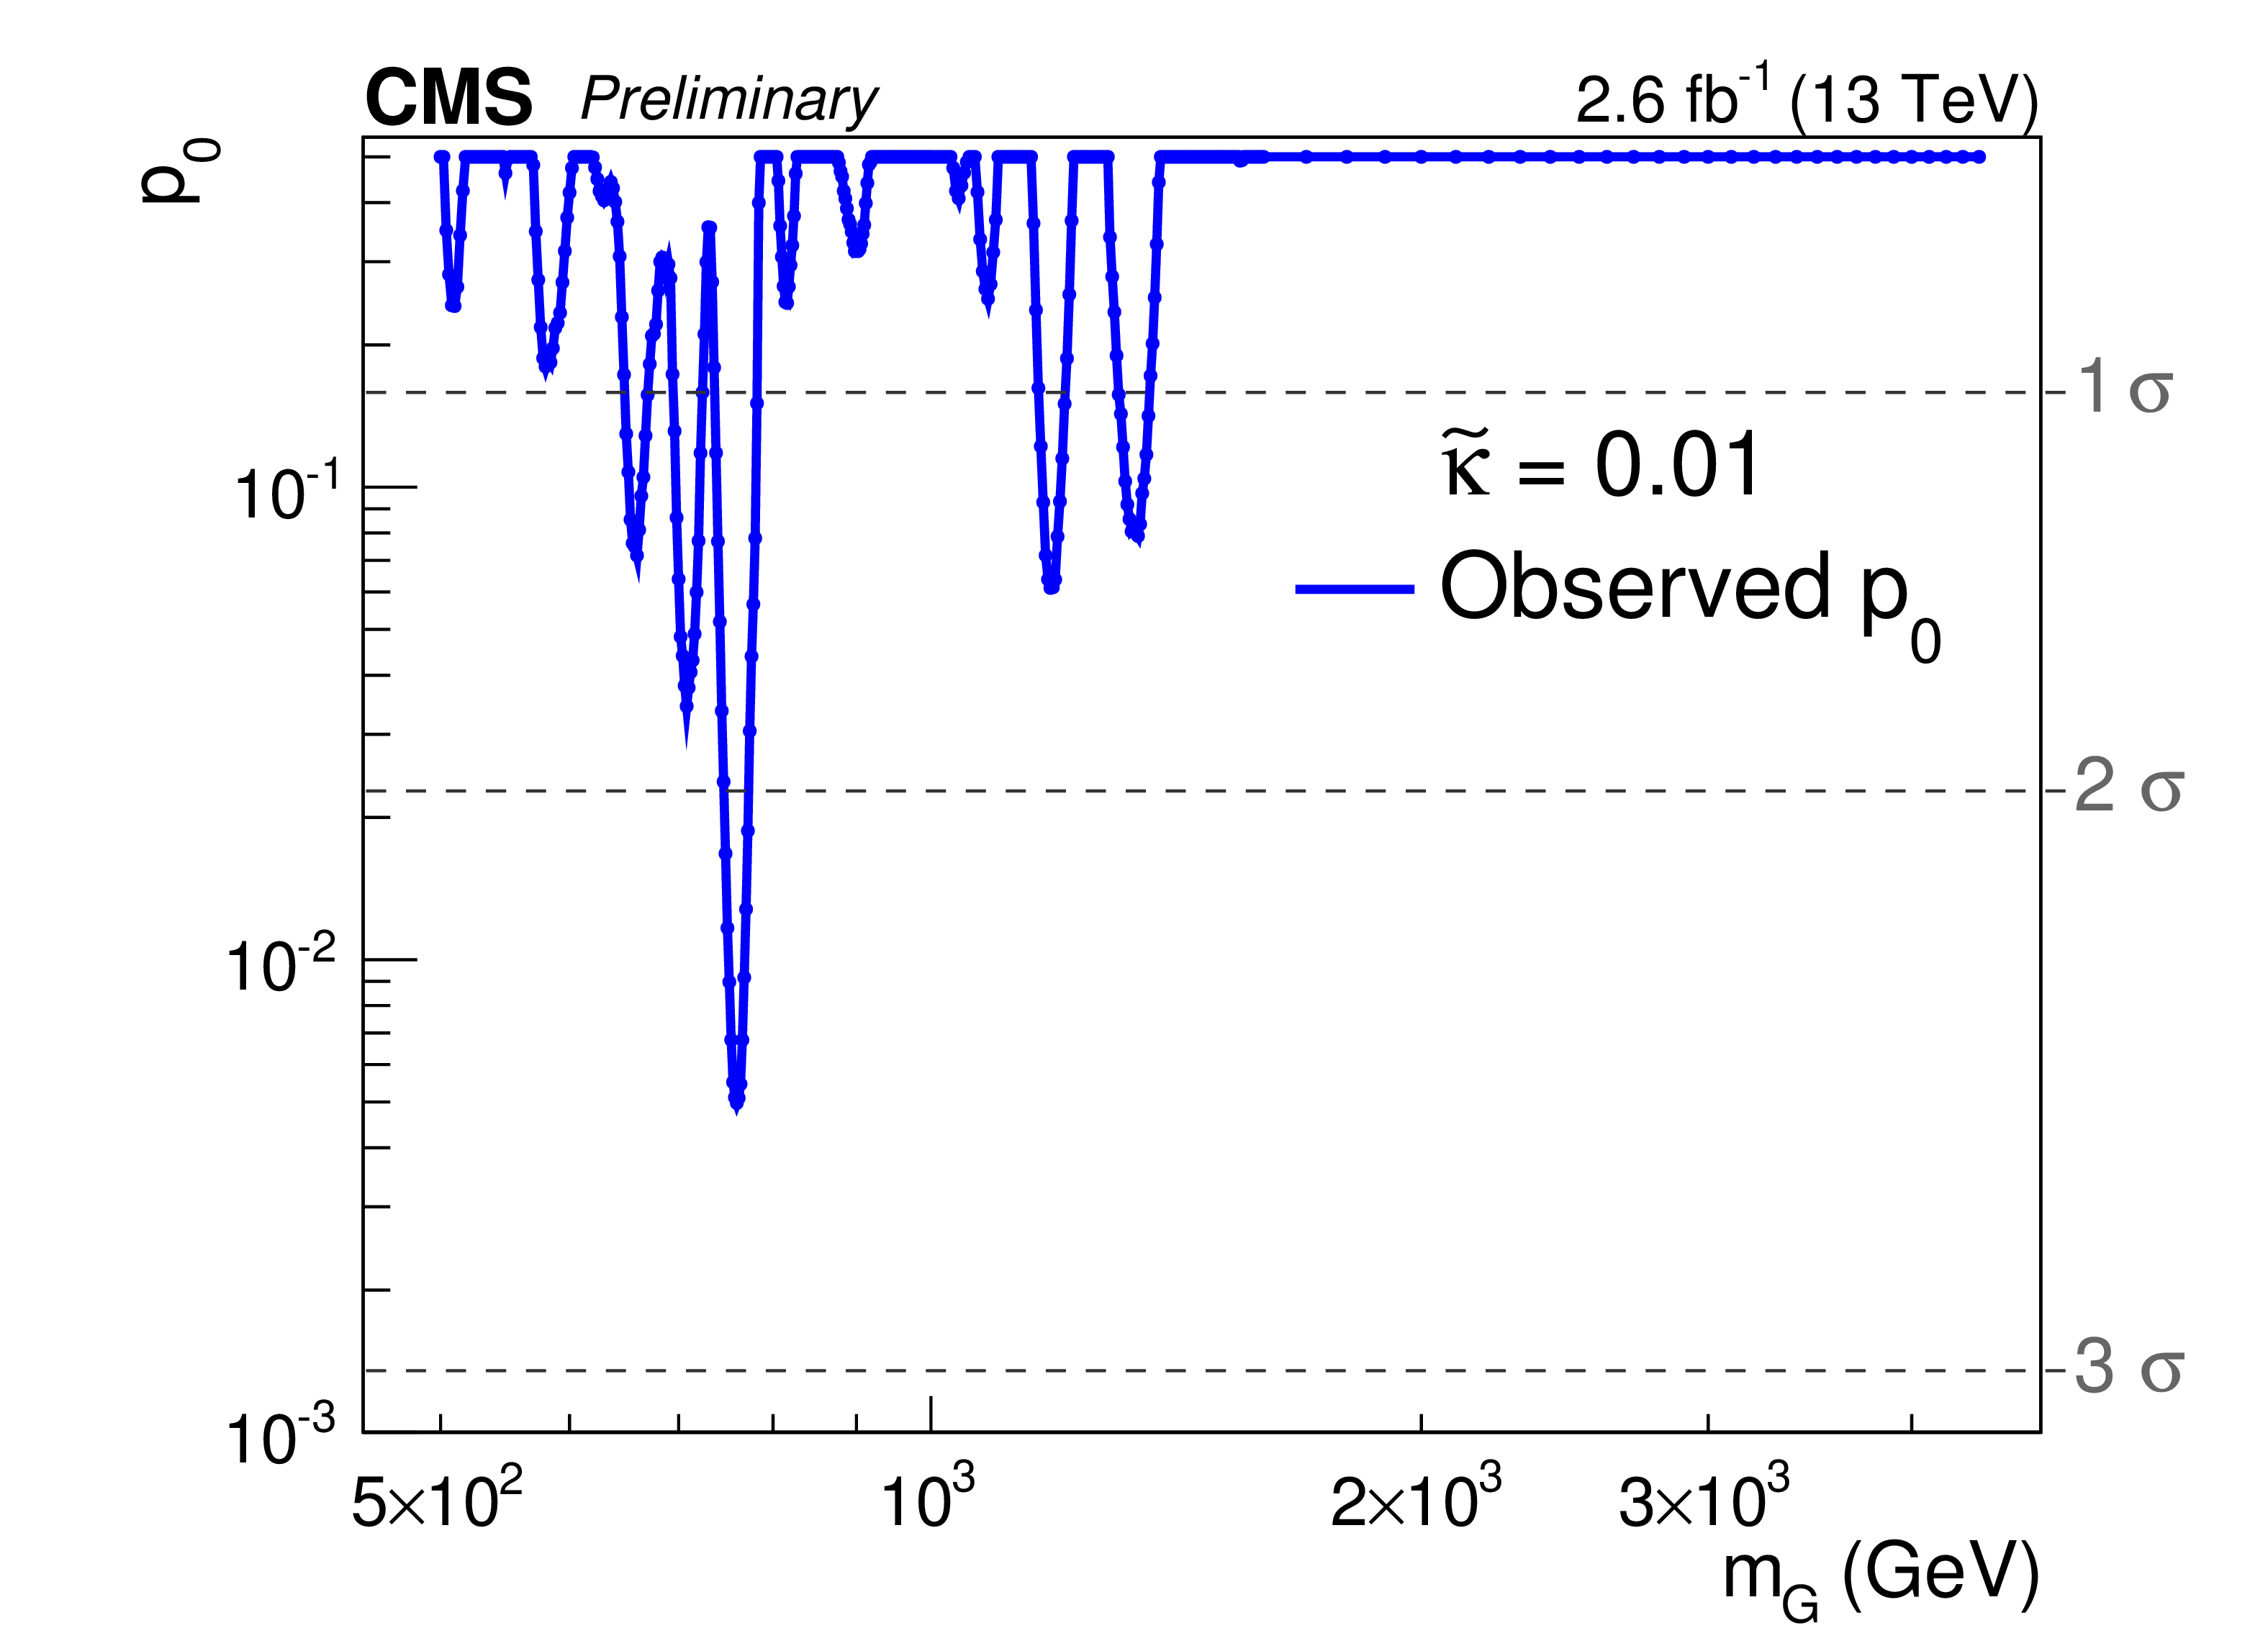
Figure 4: The probability for a statistical fluctuation at a given mass in the search range of CMS. The lowest probability occurs at 760 GeV and is equivalent to 2.6standard deviations (2.6 sigma). |
ATLAS, therefore, answered the latter question: "what is the probability of seeing an excess of over four sigmas, with any mass and bell width in the search range?". In answering that, the significance degraded to 2.2 sigma, which means, the probability to see a fluctuation as the one we see or bigger, is 1.5%. This is considered a low probability. Two sigma fluctuations are very common and frequent when we make hundreds if not thousands of measurements. This is the reason ATLAS took their 750 GeV 4 sigma excess with a grain of salt and played it extremely low.
You probably wonder what CMS have observed at the same mass range.
Figure 4 shows the probability for fluctuations at given masses as recorded by CMS in 2015. The lowest probability occurs at 760 GeV and is equivalent to a significance of 2.6 sigmas. When one takes the Look Elsewhere Effect into account, this probability is completely degraded and is becoming 1.2 sigma. One sigma fluctuations are so frequent that no one pays any attention to them.
Nevertheless, the very fact that BOTH experiments see the most significant excess around the same mass (750-760 GeV), and the high significance of close to 4 sigmas observed by ATLAS, generating lots of excitement in the High Energy Phenomenologists community.
While I write these lines, one day after the release of the results, there are already over ten papers on the web. All of them trying to explain the unexpected excess and why it prefers to decay to two photons, and not to anything else…. From one of them, by Buttazo et. al. (“ Knocking on New Physics' door with a Scalar Resonance”) I stole the title of this post.
Luckily for us, we will know the answer in about half a year, when the accelerator that is now in shutdown, will resume its operation in spring 2016. Until then the phenomenologists can continue to dream and enjoy the doubt.
Bibliography:
1. ATLAS note: ATLAS-CONF-2015-081 https://cds.cern.ch/record/2114853/files/ATLAS-CONF-2015-081.pdf
2. CMS note: CMS-PAS-EXO-15-004 https://cds.cern.ch/record/2114808/files/EXO-15-004-pas.pdf
3. 1-D Look Elsewhere Effect: Eilam Gross and Ofer Vitells, Trial factors for the look elsewhere effect in high energy physics, Eur.Phys.J.C70:525-530,2010, http://arxiv.org/pdf/1005.1891v3.pdf
4. Multidimensional Look Elsewhere Effect: Ofer Vitells and Eilam Gross,Estimating the significance of a signal in a multi-dimensional search, Astropart.Phys. 35 (2011) 230-234, http://arxiv.org/pdf/1105.4355.pdf
5. Routines for calculating the LEE based on the above papers: Kyle Cranmer, GitHub, https://github.com/cranmer/look-elsewhere-2d


Comments