


RTP creates a financial incentive for customers to change usage habits to take advantage of lower-priced hours and avoid heavy usage during higher-priced hours. This provides customers with the opportunity to achieve substantial savings without the need for significant capital expenditure. Other potential benefits include helping to reduce carbon emissions and reducing stress on the system during times of peak demand.
Through the allocation of electricity using real prices, significant benefits may be gained by the state, both in cost savings, as well as revenue producing activities. Significant amounts of electricity are wasted each year due to baseload generating requirements of state owned power generating assets. This wasted electricity may be used by the New York Power Authority (NYPA) to shift load in government, commercial and industrial consumers, which has the potential to save significant amounts of money.
However, studies performed by Con Edison with KEMA consulting have concluded that an immediate shift to Real Time Pricing, without concomitant use of technology, would raise costs for most consumers. On an uncoordinated, small scale, difficulties arise for residential customers under the current Real Time Pricing Scheme. However, real time pricing, implemented at a large scale in industrial, commercial, and governmental buildings can produce significant savings, and spur innovation in the sector that will eventually produce mature technologies to manage real time pricing for residential customers in urban and suburban settings.
Because of the significant costs of installing new technologies on the residential and consumer level, it is up to New York State to provide the impetus for the development of mature technologies to transfer to the residential sector. When the state has utilized technologies such as smart metering and load shifting technologies, the resulting matured technologies can be transferred to vulnerable constituents in the state, such as the elderly. Thus, a staged policy for implementation of RTP must be considered so that technologies such as smart metering will have the opportunity to mature to the extent that vulnerable constituents will not suffer negative consequences as the result of the change.
This study argues New York State should use its scale to spur innovation in advanced smart metering and load shifting technologies, which can then be transferred as mature technologies to constituents such as the elderly, and other residential electricity consumers who might otherwise be negatively affected by a regulatory mandate for Real Time Pricing at the Residential Level. The State also benefits from cost savings, and additional revenues if surplus power is properly managed. With additional data, feasibility studies may be conducted to determine the cost savings and revenue generating possibilities for government-owned buildings and resources. The revenue generated from these resources could be significant, and would represent a significant boon for New York State.
This study provides estimates of cost savings using real electricity price and electricity demand data using real government buildings data from New York City. The analysis centers on the potential cost savings that can be achieved by limiting electricity usage during critical time periods through the use of technology to utilize cheap baseload electricity during off-peak hours to store energy for use during peak hours. Heating Ventilating and Air-Conditioning (HVAC) systems throughout large government buildings can be one of the most promising sources of cost savings. This equipment also represents a significant portion of a building’s load that may be shifted. Our model analyzes the potential cost savings associated with shifting or eliminating HVAC use during peak demand periods.
The analysis reveals these main insights:
1. Residential Real Time Pricing will require smart metering and intelligent monitoring to pay off for residential consumers, particularly the elderly and infirm, who do not have the capacity to adjust their electricity usage with price signals. Separate schedules may be pertinent for these groups.
2. Load reduction and load shifting results in greater cost savings for government buildings. Load shifting allows for the same level of operations at a lower overall cost; load reduction does not allow for full capacity usage.
3. Extreme peak prices occur more frequently in the summer than during the rest of the year and during the late afternoons, while lows occur in the middle of the night. Thus, with air conditioning being the greatest expense, chillers may be used to shift baseload, making this a particularly easy opportunity to explore.
4. Peak price hours differ from the hours in which load shifting should occur.
a. Peak price hours occur in the late afternoon and evening.
b. Load shifting hours occur in the morning.This last insight implies that it may be possible to combine load reduction and load shifting in order to maximize cost savings.
The following charts reveal our estimates for the annualized savings per kW and per average building across a variety of load reduction and load shifting scenarios that will be discussed in greater detail: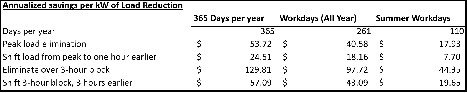
For instance, performing load shifting in three-hour time blocks would save approximately $19.65 annually per kW shifted and for a building that could shift 125 kW of load, the annual savings would amount to $5,543 per building.
Moving usage away from periods of peak demand reduces demand growth and the construction of costly peaking generators. Every 100 MW of reduced peak-hour consumption will ultimately save New York ratepayers roughly $8.5 million per year in avoided capacity value. Each 100 MW of usage moved from the top 20 percent of hours to off-peak periods will save customers an additional $5 million per year in energy savings.
In short, in order to take advantage of RTP without hurting residential consumers, it is up to the state to first demonstrate that a RTP scheme is feasible on a large scale. Furthermore, by installing RTP equipment, the state not only saves on costs, it also creates opportunities for businesses to mature their energy efficiency and smart metering technologies to a level which may be used by residential consumers without increasing their costs.
Financial Companies are already looking into the feasibility of financing retrofit projects. However, while the interest exists, the track record for retrofits does not exist as of yet. In order to facilitate private capital toward the development of residential advanced metering and RTP schemes, a proof of concept must be performed by the State.
After the State and Municiple governments demonstrate that RTP and retrofits save significantly on both demand side costs and supply side costs, Commercial and Industrial customers may be shifted to RTP, particularly those who are supplied by state owned authorities such as NYPA. Finally, after technologies and concepts have been significantly demonstrated, residential customers may begin to gain the benefits of real time pricing without the costs.
Section 1 provides policy as well as background about real time pricing and Section 2 discusses aspects of the price which may be exploited to generate cost savings and surplus revenue for the state. Section 3 quantifies the savings opportunities that the city might be able to capture under a RTP scheme and applies this analysis to the Municipal Building as an illustrative example. Finally, Section 4 suggests implementation processes and technologies to facilitate load reduction and load shifting. More specifically, the last section outlines the implementation of a real time pricing program for New York City and discusses the importance of Advanced Metering Infrastructure (AMI) and other potential revenue generating technologies, which may utilize otherwise wasted electricity.
Section 1. Staged Policy Regarding Real Time Pricing
While real time pricing at present does not produce immediate benefits for residential customers, this is primarily due to the poor penetration of technologies into the real time pricing scheme. Advanced metering penetration is less than 5% due both to the immaturity of the technology, as well as the lack of widespread deployment of the technology. In order to facilitate the energy savings, environmental improvements, as well as peak reduction, while overcoming the initial investments required, large scale customers must be first adopters so that technologies may mature to the point that individual consumers may also benefit from real time pricing.This section will first discuss the fundamentals of Real Time Pricing as it stands now, with a brief discussion about why prices differ so much between peak and trough, as well as how real time pricing affects different constituencies. This section will also discuss methods for shifting load from periods of low prices to periods of high prices. Finally, this section will discuss the current rate structure of the New York Power Authority (NYPA) and how governmental organizations in the state work with the Authority.
The Fundamentals of Real Time Pricing
The New York State electricity system is based primarily on coal-fired power stations which cannot be turned on and off at short notice. It takes time to heat boilers and raise water temperatures and steam pressures. Thus, in order to generate enough power during peak demand hours, power plants must also generate wasted power during off-peak times. The cost of generating the wasted electricity must be covered by the high prices of electricity during the day. The wasted electricity is dissipated as heat, as no major storage mechanisms for the electricity are in use. Since producers set prices based on their costs, users who shift demand to lower cost times increase the overall welfare of the system, lowering costs to other peak demand consumers, while also delivering revenue to producers who otherwise would have thrown away the electricity.
Unfortunately, at present, the technologies for real time pricing and advanced residential metering are not yet fully accepted by all constituents. Particularly, elderly constituents may have difficulties with new technologies. Studies by Con Ed have concluded that in order for such customers to benefit from real time pricing, three conditions must be met:
1) Ability to Shift:
Most importantly, users must be able to make decisions that impact the usage profile of energy.
This is not a trivial point—owners of continuous process activities cannot adjust energy utilization once the process has been initiated. Processes tied to rigid labor practices also limit the flexibility required to shift demand in the short run. However, in many commercial and government buildings, the opportunity exists to shift a large portion of load consumed by HVAC systems.
Residential Customers would suffer the most from this aspect of real time pricing, since they neither have training nor experience to manage a dynamic electricity system. Furthermore, the demands of residential customers are not as easily shifted as commercial customers who have centralized systems in place to manage power consumption. In order to facilitate equivalent technologies in the residential sector, the state government may use its scale to spur innovative technologies.
2 Visibility of Pricing Signals
Secondly, the infrastructure must exist to communicate current prices to those making the consumption decisions. Prices are typically communicated one day ahead. However, without an automated system in place to change consumption patterns and shift load for residential customers, it is not feasible for most residential customers to monitor real time prices and react accordingly.
3 Sensitivity to Price Variation
Finally, energy users must have some level of sensitivity to price for any impact to be achieved from dynamic pricing. This is the most controversial of the underlying premises for real time pricing and little empirical data exists to inform the issue in either direction. Later in this report, we briefly summarize studies that have been performed to estimate how consumption varies with price.Effect on Residential Elderly
The elderly are affected negatively by the three conditions of real time pricing, so much so that AARP stands against Real Time Pricing for residential consumers. The elderly have more difficulties adjusting to new technologies which enable them to change their usage patterns. The same issue faces elderly members who may lack the ability to monitor price signals. Sensitivity to Price Variation is one condition to which the elderly are sensitive. However, because the first two conditions make electricity more expensive for the elderly, the overall benefits to them are negative.The reason for the lack of residential dividends to real time pricing, and load shifting, are due to the lack of widely distributed technologies such as smart monitoring and advanced metering which can automate the response of electricity consumption. In residential units, these technologies must be installed unit by unit, making widespread adaptation difficult to promote. Because the private sector does not have the scale to demonstrate the technologies necessary to make real time pricing and load shifting efficient, it is up state producers and consumers to act as first movers to overcome initial barriers.
The figures below show the low penetration of advanced metering technologies which would make residential real time pricing beneficial for all customers. Smart metering can detect periods of high prices and execute preset programs to reduce and shift load on a retail level.
Large Commercial, Industrial, and Governmental Users may achieve significant cost savings by practicing load shifting. Because large facilities have centralized heating venting and air conditioning systems (HVAC), these systems may be modified to take advantage of cheap baseload pricing during off-peak hours. While the amount of electricity used is increased under load shifting, the amount of money spent on electricity is decreased, since the electricity consumed may be up to 100 times cheaper.
Furthermore, large utilities and state run power authorities such as the New York Power Authority (NYPA) have the ability to utilize wasted baseload energy through new storage mechanisms such as hydrogen storage, chemical storage, and physical storage, with these methods, electricity is used to produce a useful and valuable product with energy that would have otherwise been wasted. Private third parties may also benefit from the low cost of off-peak hours, if given direct access to the grid. Businesses may produce useful chemicals such as methane, hydrogen, and even gasoline, all from green feedstocks, and carbon neutral sources.
NYPA and NYS Government Customers
NYPA has retained consulting firm Black and Veatch and is partnering with its government customers to begin the dialogue regarding real time pricing. Given the tremendous challenges in capturing real time costs, monitoring hourly usage, and effectively administering a dynamic system, rolling out a fully implementable real time pricing regime is likely not a short-term reality. That being said, analyzing the current economics of both energy provisions by NYPA and energy consumption by a sample of NYS government buildings could yield interesting insights into the present opportunity moving towards a real time pricing regime represents for New York State.
NYPA’s Rate StructureNYPA structures its rates to breakeven on fixed costs of capacity and variable operating costs required to meet its customers’ demand. NYPA rates for NYC government customers are divided into demand and energy components. “Demand” is based on the maximum demand for each location and captures the cost of the infrastructure required to meet that requirement. “Energy” is based on the actual consumption of electricity at the respective sites.
For buildings with a maximum capacity greater than 1500 kW, NYPA provides a split rate depending on the time of day. Under this structure, “Peak” pricing is applied from 8am until 6pm on weekdays while “Off-Peak” rates are applied to all other times. These rates are updated yearly to reflect changes in demand patterns. A monthly adjustment charge is also applied to cover unexpected fluctuations in production costs. While the time of day structure attempts to model the higher cost of energy production in peak hours, the rates themselves are not directly tied to actual production costs. NYPA currently has consultants working on updating the rate structure to incorporate the variances in cost of production into the time of day cost structure. This is seen as the first step in moving toward an eventual dynamic (hourly) pricing structure.
NYISO Day Ahead Pricing
NYISO publishes contractually binding day ahead prices to assist electricity generators in planning their production. Roughly half of the energy passing through the NYISO system participates in this day ahead structure. The remaining half is primarily bilateral contracts outside of the day ahead market. Although the day ahead prices published by NYISO are wholesale rates, they represent a proxy for the retail rates NYC government customers would face in a real time pricing scenario. These day ahead rates are used in our model to simulate the effects of price motivated load shifting.
The risk with using NYISO prices as a proxy for NYPA dynamic pricing is that NYPA generated energy is potentially produced with a cost profile structurally different from the underlying economics that the day-ahead segment suggests. However, because NYPA charges a set two tier rate, this simple structure may be used as for an initial feasibility study for state buildings.KEMA Consulting Study
A study performed by KEMA consulting analyzed the results of ConEd customers that have been on a real time pricing scheme for the past two years. While the study was quite limited in its scope (73 energy users), the results are potentially informative as it addresses the three premises outlined above:
Ability to Shift: 78% of respondents were able to actively respond to high prices through operational or process related changes. 15% of respondents were unable to make any changes to energy demand patterns.
Access to Pricing Data: Facility managers who had access to price data were more responsive to price signals. This seemingly trivial point should be kept in mind in crafting a dynamic system.
Price Sensitivity: The study concluded that real time pricing did not produce sufficient variations in price to affect demand patterns. Under real time pricing schemes overall electricity bills went up an average of 1% while usage was not materially changed.
This study shows that without state impetus to demonstrate the financial opportunities as well as large scale demand to generate technological innovation, RTP would not be a feasible option for NYS.
Section 2. The NYISO Data Set
NYISO Data
The New York Independent System Operator (NYISO) operates high-voltage transmission networks, and administers the wholesale electricity markets within the state. The NYISO trades over $11 billion in electricity each year. This data was gathered from Bloomberg and includes hourly prices from 1999-2008.
NYISO pricing data is a good proxy for day ahead real time prices because it provides the marginal price of purchasing an additional unit of electricity for the day ahead market. As mentioned previously, approximately half of the energy passing through NYISO system is on Day Ahead pricing. Utilities pay the Independent State Operators (ISOs) these marginal rates when they require additional generating capacity to meet their consumers’ demands. Thus, providers of New York State’s power supply may also purchase power on these markets. Further, because the prices reflect day ahead pricing, power managers can plan ahead and make load-shifting decisions based on the prices made available the day before. Finally, algorithms may also be used to automate the process and construct the optimal load shifting profile based on the previous day's price.Although the data represents a good proxy for real time pricing, it has several limitations. One limitation of this data is that it does not accurately reflect transmission, service, and delivery costs. These costs cannot be inferred from the prices given and must be based on the pricing models of the utilities themselves. Furthermore, while there are very large peaks and troughs in the hourly pricing curves, it is impossible to determine how the entry of a load shifting power consumer would shift the demand for the electricity. If New York City's demands are such that they overwhelm the NYISO system, then the potential cost savings to the consumer would disappear, though the producer response of reducing peak generators and increasing baseload generators would result in expanded welfare for the system and state as a whole. Efficient market theory would predict this to occur, as the opportunities to arbitrage the price differentials would tend to smooth out the price curves. Thus, the prices given in the NYISO are only reflective of the potential real time, or day ahead pricing received by the city, if the amount of power consumed by the city is relatively small when compared to the total amount of electricity being traded on the NYISO markets. A set of sample charts may be found in the appendix of this paper which are representative of the peaks and troughs in various times of the year.
Section 3. The Potential Cost Savings of Load Reduction and Load Shifting under Various Scenarios
Using the NYISO pricing data (Location Based Marginal Price for New York City) from January 2003 to November 2007, we created a model to identify the potential cost savings that can be achieved by limiting electricity usage during the time periods in which electricity prices are highest. Our research indicates that the Heating Ventilating and Air-Conditioning system is one of the most flexible sources of energy use in New York City buildings. Currently, building managers shut down chillers for significant periods of time during peak load emergencies in the summer. In addition to the downtime flexibility that the chiller and pumps offer, these appliances represent significant portions of a building’s load. Our
model analyzes the potential cost savings associated with two main strategies: shifting or reducing load.
Peak load reduction consists of avoiding electricity use during certain periods of time when electricity prices are highest. This can be achieved by raising target temperatures on air conditioners, turning off elevators, or reducing the use of other significant appliances.
Peak load shifting consists of shifting electricity consumption from one time in a day to another; it concerns appliances that need to be used, but for which the time of use is flexible. For instance, load shifting may be achieved in an office building by pre-cooling the building before the most expensive time periods and then shutting off the chillers during the most expensive time periods.
Methodology
We considered the cost savings under four different scenarios:
1. Peak load elimination: avoiding the use of 1kW during the peak hour.
2. Peak load elimination: avoiding the use of 1kW during the peak 3-hours time period.
3. Shifting 1kW from an hour to an hour earlier, when the difference between the prices in these time periods is highest.4. Shifting 1kW from a three hour time period to the previous three hour time period, when the difference between the prices in these time periods is highest.
For each of these four scenarios, we looked at the differences in the cost savings if these scenarios were to be applied to all days in the week versus workdays only and workdays in the summer only.
We focused on load reduction and shifting by 1kW.
Peak Load Reduction
We organized the hourly pricing data set by day in order to isolate the maximum electricity price per day. For each day, we identified the peak hour with the most expensive price. We then averaged
all the peak prices for all the days from January 2003 to November 2007. We used this number to calculate the average savings from the elimination of one kW during the daily peak one-hour time period. An example of this is shown below in Figure (3.1). One can see that whereas the peak hour on January 1st occurred at 7 pm and had a corresponding price of $120.8, the peak on January 2nd occurred at 6 pm and had a price of $112.3.

Figure (3.1) Identification of Peak Hour The distribution of peak prices and when they occur.

Figure (3.2) Distribution of Peak Hour
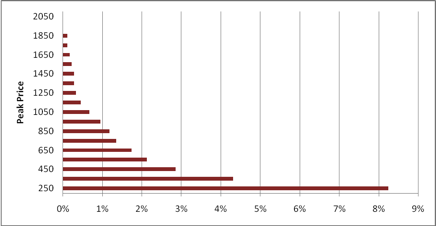
Figure (3.3) Distribution of Peak Prices ($/MWh)
As shown on Figure (3.2), the most frequent peak hour is 6pm. Figure (3.3) indicates the proportion of days where peak price exceeds certain values. For instance, about 3% of the days the peak price exceeded $300/MWh. This graph indicates that extreme values are rare. However, extreme prices result in higher savings if load is reduced.
Insofar as air conditioners are usually the most significant and easiest to control appliance in office buildings, it is important to consider the price of electricity during summer workdays.

Figure (3.4) Distribution of Peak Hours during Summer Workdays
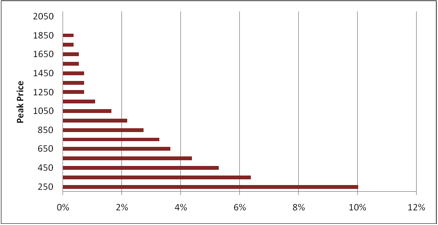
Figure (3.5) Distribution of Peak Prices during Summer Workdays ($/MWh)
As shown on Figure (3.4), peak hours occur earlier in the day during the summer than during the rest of the year. Furthermore, extreme prices are more frequent.
Many NYC buildings already reduce load during peak summer hours. Experiences at Stuyvesant High School and the Municipal Building suggest that some appliances can be shut down for several hours. This next part of the study considers peak prices when aggregated in 3-hour blocks.
This study uses the convention of labeling 3-hour time periods by the first hour of the time span. For instance, the time periods labeled as “3pm” refers to the time period between 3:00pm and 5:59pm.
First, we identified the most expensive three-hour time block. The example below shows that the peak three-hour time period on January 1st, 2003 was the 6pm time period (5:00pm-7:59pm). The savings that would be achieved by eliminating one kW of electricity usage for these three hours is shown in the figure below.

Figure (3.6) Identification of peak three-hour time period
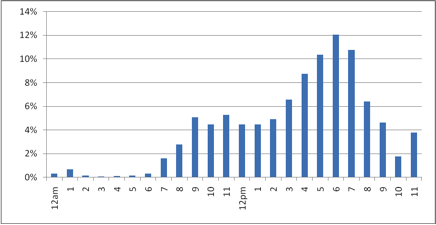
Figure (3.7) Distribution of Peak 3-hours periods

Figure (3.8) Distribution of Peak Prices (average over 3-hours periods)
The distribution of 3-hour peaks is similar to the distribution of single-hour peaks. The most frequent 3-hour peak period is 6:00pm-8:59pm. However, 3-hour peak prices are less extreme in that they do not reach the same levels (maximum 1100$/MWh, vs. 1850$/MWh for 1-hour peak) and the distribution is more skewed towards lower prices than higher prices.
During summer workdays:
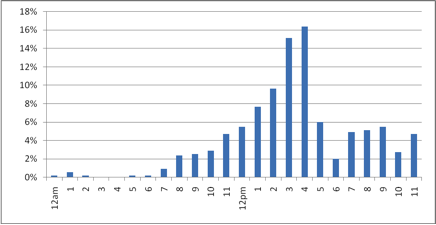
Figure (3.9)
Distribution of Peak 3-hours Periods during Summer Workdays
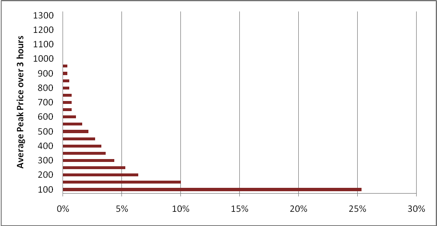
Figure (3.10) Distribution of Peak Prices (average over 3-hours periods) during Summer Workdays
When considering only summer workdays, Figure (3.9) shows that the most expensive 3-hours periods occur earlier in the afternoon: the most frequent peak 3-hours period is 4:00pm-6:59pm. Earlier periods are also frequent. This may be due to the massive use of air-conditioners during the summer, peaking in the afternoon when the temperature peaks. Again, reducing load during the most expensive periods of time would increase savings.
Load Shifting
Whereas load reduction involves identifying the time of peak price and reducing load at that time, load shifting involves identifying when the difference between prices in adjacent time periods is the greatest and shifting load from the more expensive time period to the less expensive time period.
Thus, it is possible that the peak hour differs from the time when load shifting would occur.

Figure (3.11) Load shifting example
For instance, Figure (3.11) represents sample price data for a 12-hour period. The peak price of 100 occurs at 6pm. However, the maximum price differential occurs between 4pm and 5pm. By shifting load from 5pm to 4pm, a savings of “20” can be achieved for each unit of load shifted.
This is also true for 3-hour time blocks – the peak 3-hour time period may differ from the time period in which load shifting should occur.

Figure (3.12) 3-hour time block shifting example
This is shown in Figure (3.12), which aggregates the hourly pricing data from Figure (3.11) into 3-hour blocks. In Figure (3.12), the peak 3-hour period occurs from 9:00pm to 11:59pm. However, the maximum load shifting opportunity exists by turning off appliances between 3:00pm and 5:59pm and, instead, using the appliances during the period between noon and 2:59pm. In this instance, savings of 85 dollars/MWh could be achieved for each unit of load shifted per day.Results
As expected, our results find that permanent load reduction results in the greatest cost savings. More specifically, a reduction of one kW during the peak hour of everyday in a year results in $53.72 in
savings. As one would anticipate, the annualized savings to decrease as we move from shifting behavior throughout the whole year to only during workdays to only during weekdays in the summer. Nevertheless, a one kW reduction during the peak hours in the summer workdays still results in $17.93 annual savings per avoided peak kW. The savings resulting from the elimination of one kW during the peak three-hour period is $129.81, which is more than double that of eliminating the same kW during the peak one-hour period.

Figure (3.14) Annualized Savings per kW of Load Reduction under various situations
If these savings are scaled up for an entire building, the annualized savings increase dramatically. If we assume, conservatively, that a building could reduce 125 kW of load during the peak three-hour period, savings could reach $16,226 per year. This amount becomes $5,543 if the program is only run during summer workdays and $2,456 if the program involves three-hour load shifting on summer workdays as opposed to total load reduction.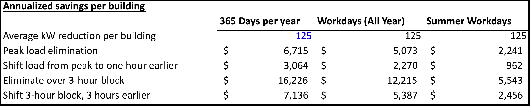
Figure (3.15) Possible savings on the building scale.
Overall, our results suggest that the buildings can capture substantial cost savings not only by completely eliminating overall electricity consumption, but also by running some appliances at the lowest cost time periods. The issue then centers on how shifting appliance use in this manner impacts building performance. In practical terms, shifting chiller usage to one hour earlier or even three hours earlier would not be exceedingly difficult. Furthermore, with new technologies and materials, energy losses from load shifting can be heavily mitigated.Furthermore, buildings may be able to increase savings by performing both load reduction and load shifting, as discussed earlier. For instance, if done simultaneously over 3-hour blocks during summer workdays, a 125kW adjustment would result in $5,543 + $2,456 = $7,999. A good assumption would be 10kWh per person per month in a commercial space. With 1.3 million state employees, at least half of whom have some sort of office space, this amounts to at least 6,000,000 kWh per month and 60,000,000 kWh. Even a small shift in this number could produce very significant savings of millions to hundreds of millions of dollars.
A Practical Application: The Manhattan Municipal Building
The Manhattan Municipal Building is involved in a Peak Load Management Program monitored by the New York Power Authority. In order to identify load curtailment potential, a load review of the building was prepared by RLW Analytics, Inc.
This report focuses on chilling system and elevators. It states that raising the set point temperature in the building by 3-4°F would result in a 310kW demand reduction. Concerning elevators, it identified a 30kW load reduction opportunity.
Figure (3.16)
Potential Savings for the Chilling System
As shown before, shifting time and peak periods do not usually occur at the same time (“best” shifting time is likely to occur around 7am, whereas prices usually peak in the afternoon). Thus, in most of the cases, it is possible to take advantage both of load reduction and load shifting; thus, to add savings. In the best case scenario, the savings could amount up to nearly $20,000/year without compromising comfort of building occupants. The shifting potential could be determined experimentally with a better accuracy: the main issue is to determine the maximum shifted load and shifting time that are acceptable in term of their consequences on space temperature evolution.
Elevators carry much lower savings opportunities. Moreover, elevators can be only subject to peak load elimination: load shifting does not apply. However, this peak load reduction could be achieved all year round. This gives an order of magnitude of the achievable savings. To quantify a building savings potential, a precise load review is needed, and load shifting experiment may be carried on to determine the maximum acceptable load shifting.
Section 4. Implementation of Load Reduction and Load Shifting
From the results in section 3 which uses real building data from government buildings to simulate load reduction and shifting, it is apparent that substantial cost savings may be generated within New York City for government bulidings with large HVAC systems. Our pilot study looks at the full potential of costs savings. If successfully implemented, this program represents a transitional step towards an eventual real-time pricing program as well as the development and financing of new technologies to improve energy effciency.Overview
The Peak Load Reduction pilot program is being proposed to grow the culture in New York City about saving energy efficiency and peak load cost savings. The program is meant to change the mindset of people about energy reduction by a series of load reducing steps. This program will provide an opportunity to achieve real electricity load reductions during times of peak demand. There will be immediate cost savings and a very low cost of implementation. This savings will grow as time of use and real time pricing programs are implemented because the program is reducing usage at the times of highest cost.Finding Energy Reduction Opportunities. It is integral to assess and audit the buildings to find curtailment opportunities. Every building is unique, but for the most part, the opportunities are similar. This can be an informative process that gets the involvement of the individual energy management teams at the buildings. For example, some buildings have central A/C, others use window A/C units and some use both. In 2001, a study by RLW Analytics performed a load management building assessment at 1 Centre St and identified the following list of opportunities. This is an example of a load reduction plan that each building should follow.
The following six curtailment strategies have been identified for implementation in the Manhattan Municipal Building:
1. Raise chilled water temperature from 42°F to 45°F to around 46°F to 48OF.
2. Raise space temperature set points to 78OF.
3. Sweep the building, turning off window AC units in unoccupied areas, and asking occupants to decrease the power setting on AC units in occupied areas.
4. Shut off thirteen of the twenty-eight general service elevators and any of the other elevators where practical.
5. Turn off lighting in unoccupied areas and any other lighting that can be curtailed in occupied areas by performing a floor-by-floor sweep of the building.
6. Request voluntary assistance from building occupants in shutting off any unnecessary equipment and lighting by placing notices in lobby and elevator areas.
Training of building managers
Since every building is unique, it is important to do what makes sense for each building. This requires a bit of customization, but a manageable amount. Upon completion of the load management building assessments, we will create a custom load reduction plan for each participating buildings.
The building manager will receive a training session on two aspects of the program. First, they will be trained on how DCAS will communicate to them what time of day to begin the peak load reduction sequence. Next, they will be trained on how to follow their building’s energy reduction plan.Automating signals to building managers
The day ahead prices for the NYISO are posted every night at 10pm. We recommend having a simple software program that pulls these prices and downloads them to excel. The program administrator at DCAS will see the peak price hour and will send an email to the building managers telling them what time to begin the program that day. Most of the time, this hour will be the same, so there will be a large amount of consistency. It is also possible to have the email generated automatically from the software program, but this is up to DCAS to determine whether they want to be in the loop on a daily basis.
Monitoring and Measurement
In order to document and verify the success of this program, it is imperative to keep metrics of the energy usage of the buildings. The capabilities of recording energy usage at each building using smart meters is variable and more information on potential capital investments are detailed later. For the buildings that already have smart meters, the building managers will relay the data back to DCAS. For those with conventional metering equipment, the data will be retrieved from NYPA. Reports should be generated highlighting energy savings and cost savings for each building and the program as a whole.
Conclusion
In practice, the implementation of real time pricing is a complex system. For this portion of the study, we will assume the policy mechanism is in place between NYPA and DCAS to be billed on a real time basis.Advanced Metering Infrastructure (AMI) in city buildings is required to automate meter reading, characterize energy usage, and receive real time pricing signals. AMI refers to systems that measure, collect and analyze energy usage, from advanced meters through different communication methods. The system includes hardware, data management, software, and communications. Depending on the required level of technology, different meters and communication equipment exist to achieve the system goals. Some of the advanced meters include two way communication and control where the building energy usage is monitored and controlled via Wi-Fi or cellular networks.
In order to take advantage of RTP without hurting residential consumers, it is up to the state to first demonstrate that a RTP scheme is feasible on a large scale. Furthermore, by installing RTP equipment, the state not only saves on costs, it also creates opportunities for businesses to mature their energy efficiency and smart metering technologies to a level which may be used by residential consumers without increasing their costs.

Comments