

The Arctic melt, already more rapid than average this year, has begun to accelerate.
I have no doubt that by the end of this month, May 2010, there will be much less sea ice than there was in May 2007.
I have no doubt either that the anti-science propagandists will continue to insist either that the ice is recovering or that Arctic melt is perfectly normal.
The 4th IPCC report has been attacked by some people as being agendist and alarmist. Accusations have been made that data has been deliberately manipulated to make things look worse than they really are. With regard to the Arctic, the report actually had little to say, due to uncertainties. It was suggested with caveats and cautions that the Arctic might possibly become ice free by 2100.
Future changes in the Greenland and Antarctic ice sheet mass, particularly due to changes in ice flow, are a major source of uncertainty that could increase sea level rise projections. The uncertainty in the penetration of the heat into the oceans also contributes to the future sea level rise uncertainty.
http://www.ipcc.ch/publications_and_data/ar4/syr/en/mains6-2.html
When that IPCC report was published, a 'business as usual' projection predicted an essentially ice free Arctic between 2050 and 2100. Direct observations of sea ice area and extent brought the prediction forward to about 2020. The most recent peer-reviewed prediction suggests an essentially ice-free Arctic as early as 2013, as I reported in Arctic Melt 2010 Is Faster Than Models Predicted.
In my January 16 2010 article Global Cooling : Beyond Parochialism I made these predictions:
2010:
Many hottest weather records are broken in northern hemisphere.
Summer arctic ice at record low in extent.
By September the Arctic Ocean is freely navigable by both the northern sea route and the north west passage.
2011:
Reduced ice cover affects sea temperatures, in turn affecting Arctic current flows and air movements. Thinner ice, instead of piling up as pressure ridges due to compression effects, cracks into sections due to tension and agitation effects.
The Arctic is virtually ice-free by late summer: there is open water at the North Pole.
I have been tracking the way the Arctic ice is behaving this melt season. Based on my studies of prior researches by polar experts such as Frijdtof Nansen; based on his and other records of over 200 failed attempts to find a North West Passage; based on studies of the very few navigation successes of early Arctic explorers; based on reports from aerial observations, ice stations, fisheries, surface ships and submarines; based on satellite images and data collected in recent decades: I conclude that the behaviour of Arctic sea ice this year 2010 is more anomalous overall than in any preceding year for the entirety of human history.
Shorebound ice losses
The former Ellesmere Island ice shelf comprising ice at least 3,000 years old sloped from land to sea, blending land ice with sea ice and extending 9,100 km2 - 3,500 square miles - into the Arctic ocean. By about the year 2000 90% of that shelf ice was gone. The remaining parts of the shelf were thought to be stable. Most of them have also broken up. In 2002 the Ward Hunt ice shelf fractured, discharging the 3 billion cubic meter bulk of an epishelf freshwater lake. By April 2008 the Ward Hunt ice shelf had fractured into three pieces.
http://earthobservatory.nasa.gov/Features/Ellesmere/
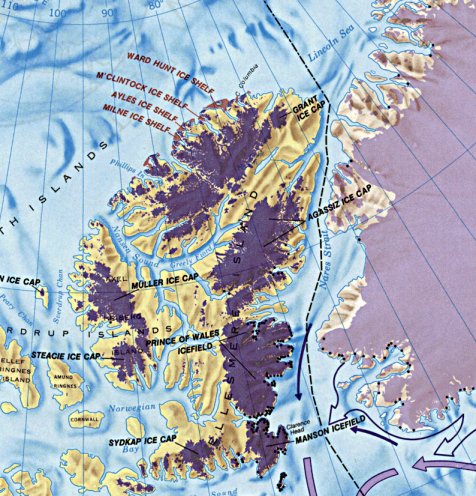
Map showing ice shelf locations, 1985, National Atlas of Canada 5th edition.
Image courtesy Natural resources Canada
http://atlas.nrcan.gc.ca/site/english/maps/archives
When an ice shelf which has formed and grown over the course of 3,000 years collapses so rapidly it is a sign that the causes of thaw are penetrating far beyond the edges of the pack ice. The greatest single cause of rapid ice melt is bottom melting from warm waters. When we see rapid and abnormal melting of land-fast ice it would be well to research the possibility of abnormal sub-surface currents.
Ice shelves July 14 2009
MODIS/Terra 2009/195 07/14/09 22:30 UTC
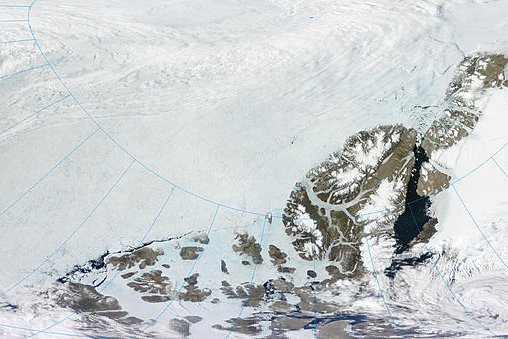
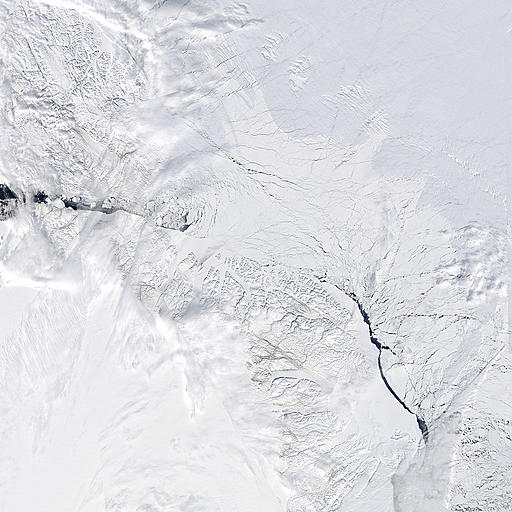
The detail below shows how much more extensive the ice break-up area is now, in early May, than it was last year in mid-June.
Ice shelves May 05 2010
MODIS/Terra 2010/125 05/05/10 19:20 UTC
Quite apart from the region of these ice shelves and the Nares Polynya extension into the Lincoln sea, massive ice break-up has now extended along the entire chain of Queen Elizabeth Islands through to Fram Strait. The map below shows, in red, the general extent of break-up.
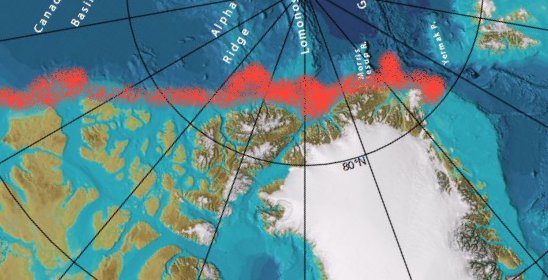
General extent of ice break-up April to May 2010.
The ice flow North of Greenland is extensive and increasing. The image below shows, red arrows, the general direction of ice flows as revealed by comparing image sequences.
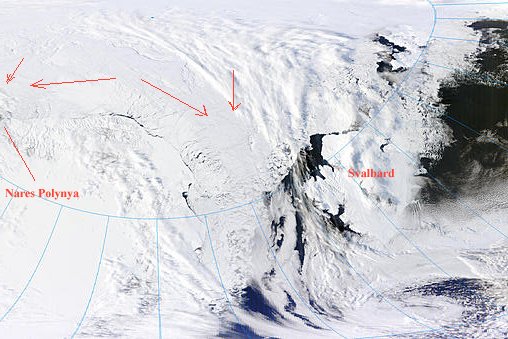
detail from MODIS/Terra 2010/123 05/03/10 17:50 UTC
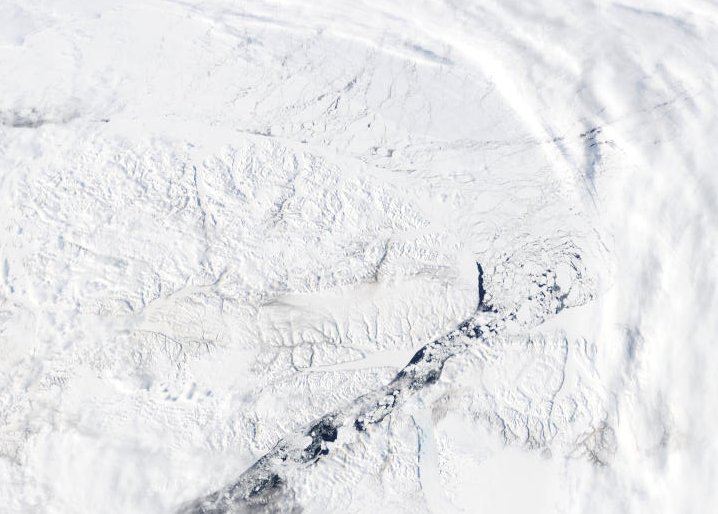
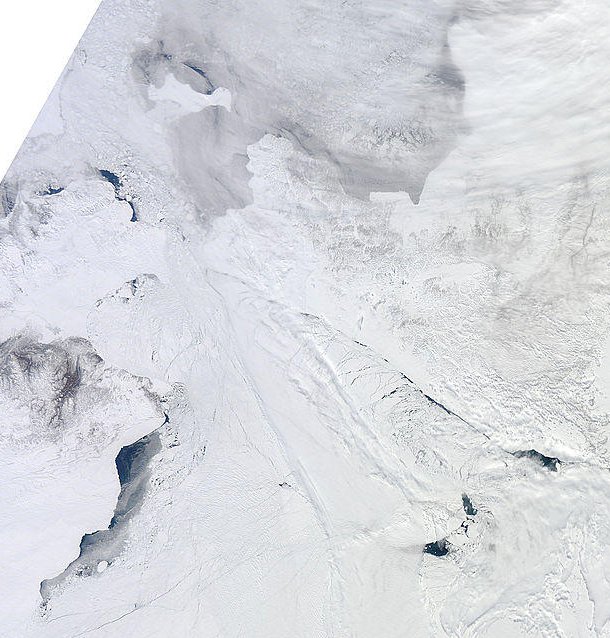
The next image is a composite created by MODIS Rapid Response. There are some artifacts from image stitching. Extensive fragmentation is usual for August-September and is usually confined to a roughly triangular area of the Lincoln Sea, here the area under cloud. Note in particular the open leads in Fram Strait, bottom right. I estimate that the heavily fragmented area in this image from May 05 2010 is about 10 times what might have been considered normal.
Arctic_r03c03 Subset - Aqua 2km True Color image for 2010/124 (05/04/10)
Due to ever-changing cloud cover, the fractures above do not show up well in today's - May 06 - MODIS Arctic mosaic image, below. I have labeled some of the areas which are of particular interest. These are amongst the most dynamic areas.
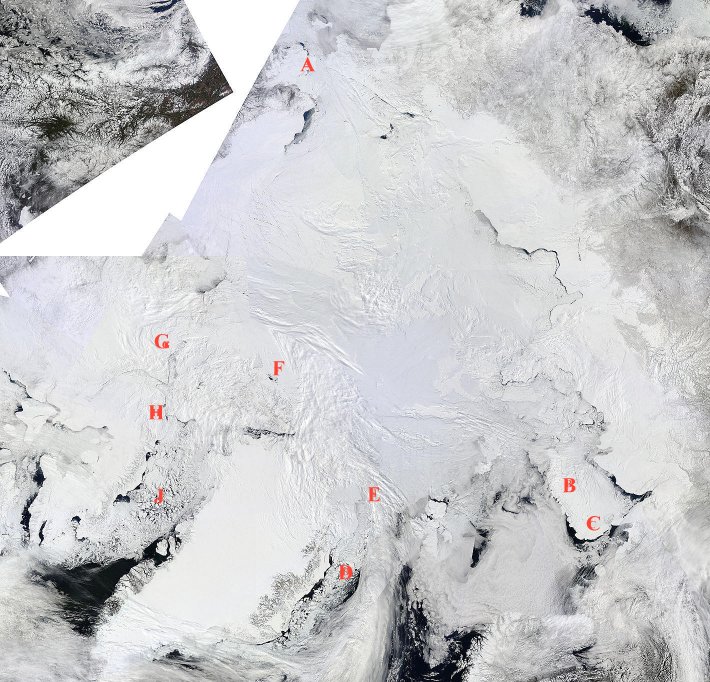
Arctic areas showing the greatest ice dispersal.
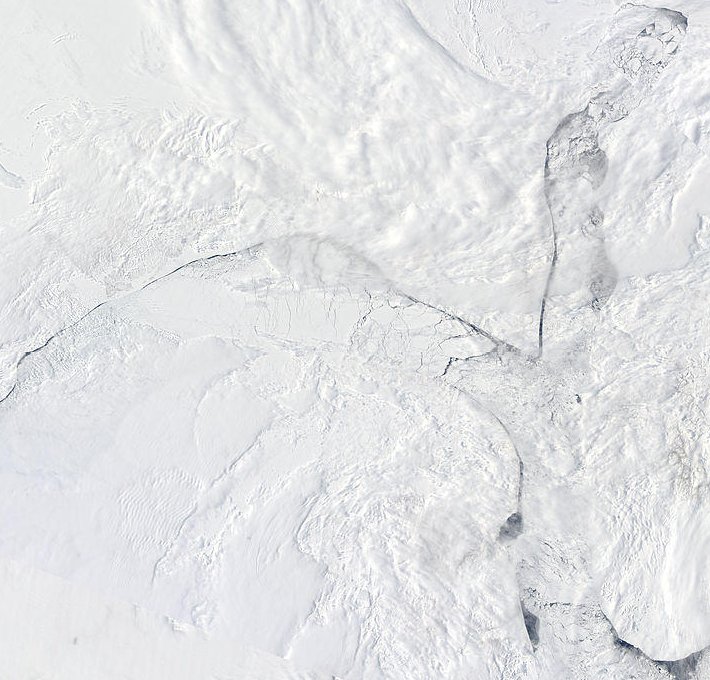
At A, the Bering Strait area, ice is beginning to disperse as it breaks into smaller floes. Note that smaller ice tends to move faster than larger, for all size ranges in open water. However, larger sizes are more likely to jam together at a bottleneck.
Ice fragmentation and dispersal in the Bering Strait area.
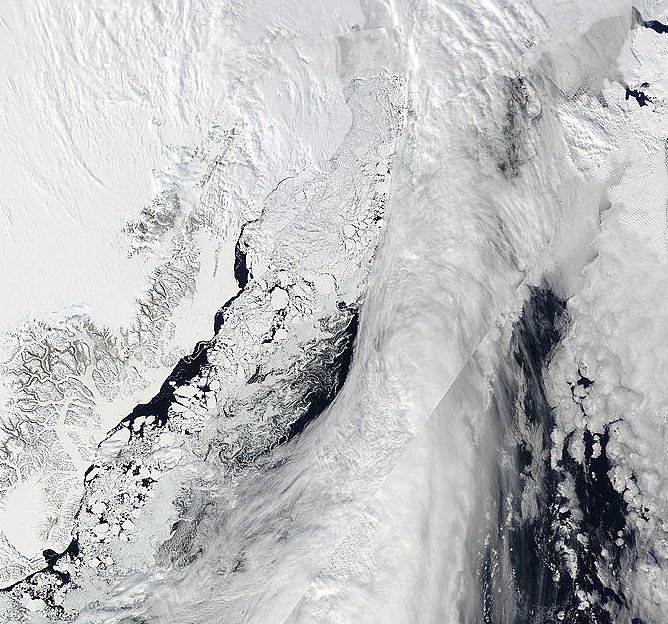
At B and C Novaya Zemlya separates the Kara Sea, here mostly iced over, from the Barents Sea, left of image. Note especially the heavily cracked main body of ice, and the bulbous area from which the ice is flowing out. These bulbous shapes seem to be characteristic of Arctic sea ice where it is being pushed as a mass towards a bottleneck, as most notably in the Lincoln Sea.
Ice fragmenting and flowing out of the Kara Sea.
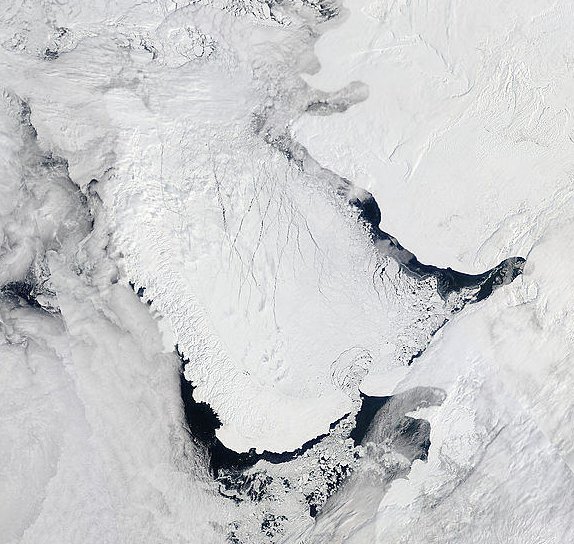
At D and E, ice which would normally be pressed against the shore of Greenland is rapidly flowing South, fragmenting and melting. Shorebound ice is rapidly breaking up. Ice which would normally remain shorebound on the North coast is flowing into Fram Strait - hidden by clouds in this image but visible in the detailed image shown earlier.
Ice fragmenting and flowing freely in Fram Strait
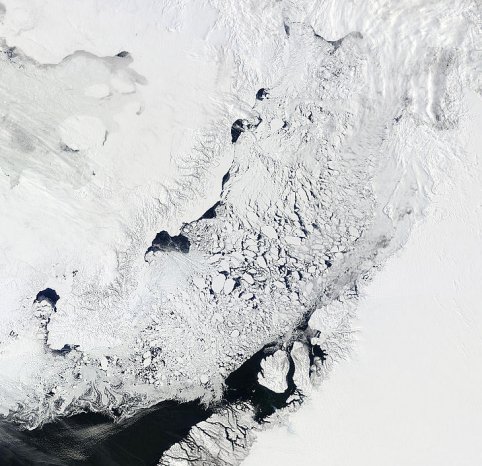
At F, this detail shows the ice to be greatly fragmented in the area formerly occupied by the Ellesmere ice shelf.
Ice fragmentation, Ellesmere Island North coast.
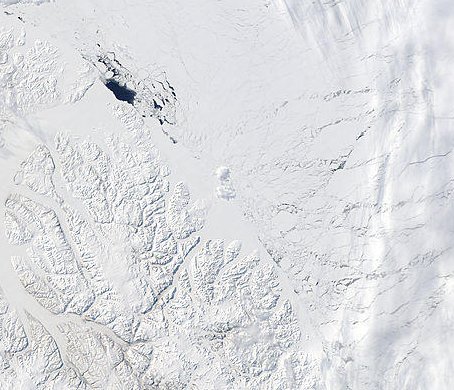
The next image, at G to H, shows a major part of the North West Passage beginning to thaw. From Baffin Bay, bottom, Lancaster Sound branches left into Prince Regent Inlet and proceeds on through Barrow Strait.
Ice breaking up in the North West Passage.
The ice from this part of the North West Passage will be more readily exported the more that Baffin Bay ice does not hinder the flow.
Ice in Baffin Bay, usually hard pressed ashore, is flowing South fairly freely as it continues to break up into ever smaller floes. Of course, 'small' is a relative term. Where the ice may move freely, even at fifty or a hundred kilometers across, a floe can be said to be small.
Ice being exported South from Baffin Bay.
It is worth noting that there are very many glaciers calving in this region. However, icebergs make up only an insignificant fraction of the ice seen in these images and can be discounted.
Concluding remarks
If you have a pond three quarters covered with ice, you have 75% ice extent. If you break that ice into tiny fragments spread over the entire pond, you have 100% extent of ice cover. The degree of that cover, fairly obviously, is still 75%. The area of actual ice is still 75% of the pond area. Extent and area are not the same thing.
The Arctic isn't a pond. When ice of Arctic thickness and mass fractures from tension or collision, vast quantities of heat are released and some of the ice melts. In winter, fresh leads ice over fairly rapidly. Ice pressed against ice bonds as if welded. These mechanisms can actually help ice to grow in mass.
When, during the melt season, ice becomes more dispersed it does so with an inevitable loss of mass. What is melted, generally stays melted.
The extent of ice during April was greater than the average for April. This does not indicate recovery. Quite the opposite: it indicates that the ice was bashed around, dispersed and above all else melted more than average.
Smaller ice floes move faster than bigger ones. As the average floe size reduces, the average speed increases. Ultimately, highly fragmented loose ice will be dispersed as fast as wind and current can carry it.
In the areas I have focussed on in this article, fragment sizes are reducing daily.
Provided only that an export path exists, reduced fragment sizes inevitably mean faster export of ice to warmer waters.
I conclude therefore that the Arctic melt, already more rapid than average this year, has begun to accelerate. If I am right about this, then official reports of ice extent for the month of May 2010, when published in early June, will almost certainly show substantially less ice than in May 2007.
Edit:
I have posted a follow up to this article Arctic Ice May 2010 - Update.
-------------------------------------------
Related articles:
Arctic Tipping Points - #1: Background And Recent History
Arctic Ice 2010 #1 - The Nature Of Sea Ice
http://earthobservatory.nasa.gov/Features/Ellesmere/
http://ice-glaces.ec.gc.ca/WsvPageDsp.cfm?Lang=eng&ID=11835
http://atlas.nrcan.gc.ca/site/english/maps/archives
http://en.wikipedia.org/wiki/British_Arctic_Expedition


Comments