


KIC 8462852 (or Tabby's star) made headlines in October of last year because of very deep and very unusual drops in its brightness, which led to speculation that the star might be home to a Type-2 alien civilization. Since then, new discoveries (e.g. Montet and Simon, 2016) have continued to baffle researchers.
There has been scant success in coming up with astrophysical models that explain these drops. Bodman&Quillen (2015), for example, propose a comet family model. Nevertheless, as the authors admit, they are unable to model the second-largest flux drop because "the flux changes too smoothly and too slowly to be easily explained with a simple comet family model." Additionally, the fit they provide for the largest and third-largest drops is not very impressive once you examine those drops individually at a larger scale.
The day-792 drop (also known as D800) cannot be produced by any solid object, natural or artificial, with a shape that makes any sense. Nor can it be produced by a family of, say, hundreds of objects, because of how smooth the light curve is. That drop would have to be produced by a swarm of countless small objects distributed in a very peculiar way. It can't be a cloud of dust, because of how the optical depth seems to distribute, unless it's a very flat or very elongated cloud of dust.
I have attempted to model the optical depth of these transits previously, based on a couple different assumptions: (1) That optical depth increases with distance from a point in an imaginary orbiting sphere, and (2) That optical depth increases depending on the distance from a vertical line in an imaginary orbiting sphere. It's possible to get fairly acceptable fits based on these assumptions.
Now, there is a third way to distribute the optical depth, which I hadn't attempted previously: As a thin band of material distributed alongside an orbit. It turns out that such a model produces less than a third of the error I was getting with models based on the aforementioned assumptions.
Day-792 Drop
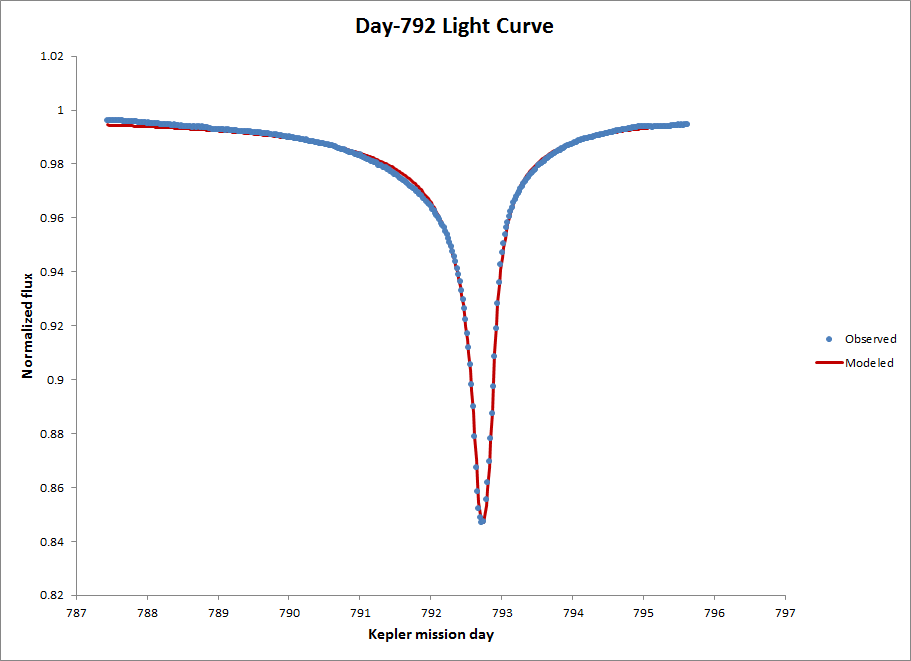
The following chart shows the observed flux measurements alongside the light curve produced by an optimized band model. The fit is excellent (RMSE ~ 0.0011) for a model with only 7 parameters that participate in the optimization process and an additional handful of hyperparameters.
The following video depicts the transit produced by the model, with some slight noise
added so that motion is noticeable.
Along the X axis, transit opacity can be approximated with a very simple formula, as follows:
There has been scant success in coming up with astrophysical models that explain these drops. Bodman&Quillen (2015), for example, propose a comet family model. Nevertheless, as the authors admit, they are unable to model the second-largest flux drop because "the flux changes too smoothly and too slowly to be easily explained with a simple comet family model." Additionally, the fit they provide for the largest and third-largest drops is not very impressive once you examine those drops individually at a larger scale.
The day-792 drop (also known as D800) cannot be produced by any solid object, natural or artificial, with a shape that makes any sense. Nor can it be produced by a family of, say, hundreds of objects, because of how smooth the light curve is. That drop would have to be produced by a swarm of countless small objects distributed in a very peculiar way. It can't be a cloud of dust, because of how the optical depth seems to distribute, unless it's a very flat or very elongated cloud of dust.
I have attempted to model the optical depth of these transits previously, based on a couple different assumptions: (1) That optical depth increases with distance from a point in an imaginary orbiting sphere, and (2) That optical depth increases depending on the distance from a vertical line in an imaginary orbiting sphere. It's possible to get fairly acceptable fits based on these assumptions.
Now, there is a third way to distribute the optical depth, which I hadn't attempted previously: As a thin band of material distributed alongside an orbit. It turns out that such a model produces less than a third of the error I was getting with models based on the aforementioned assumptions.
Day-792 Drop
The following chart shows the observed flux measurements alongside the light curve produced by an optimized band model. The fit is excellent (RMSE ~ 0.0011) for a model with only 7 parameters that participate in the optimization process and an additional handful of hyperparameters.
The following video depicts the transit produced by the model, with some slight noise
added so that motion is noticeable.
Along the X axis, transit opacity can be approximated with a very simple formula, as follows:
This type of equation is common in biology. It's equivalent to the Monod equation (Monod, 1949) and the Michaelis–Menten equation. I made a couple modifications: Opacity is truncated at some ceiling, and the coefficient (φ) is different on the left and right sides of the structure, in order to properly model the transit's asymmetry.
Along the Y axis, opacity is a Gaussian function. I could have made it a band with fixed opacity within some bounds along the Y axis, which would look more artificial, but there are algorithmic reasons (a discrete grid) why a Gaussian allows the optimization process to produce a more accurate fit.
Day-1519 Drop
The largest drop has its opacity peak on day 1519 of the Kepler mission, and is also known as
the D1500 drop. It is considerably more chaotic than D800, so I modeled it in a different way.
The baseline model is still a Monod equation, more or less, but I added Gaussian alterations
to the baseline opacity at 3 different points along the band.
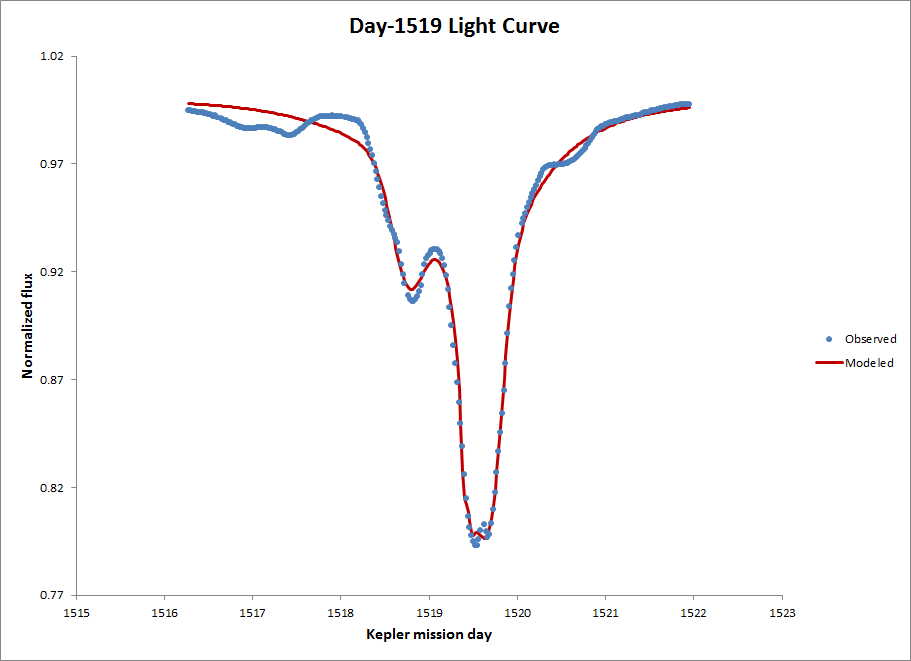
The fit is still good (RMSE ~ 0.0044) despite how chaotic this light curve is, and despite the fact that the model only has 9 more parameters than the one I optimized to fit D800. The following video depicts the modeled transit for D1500.
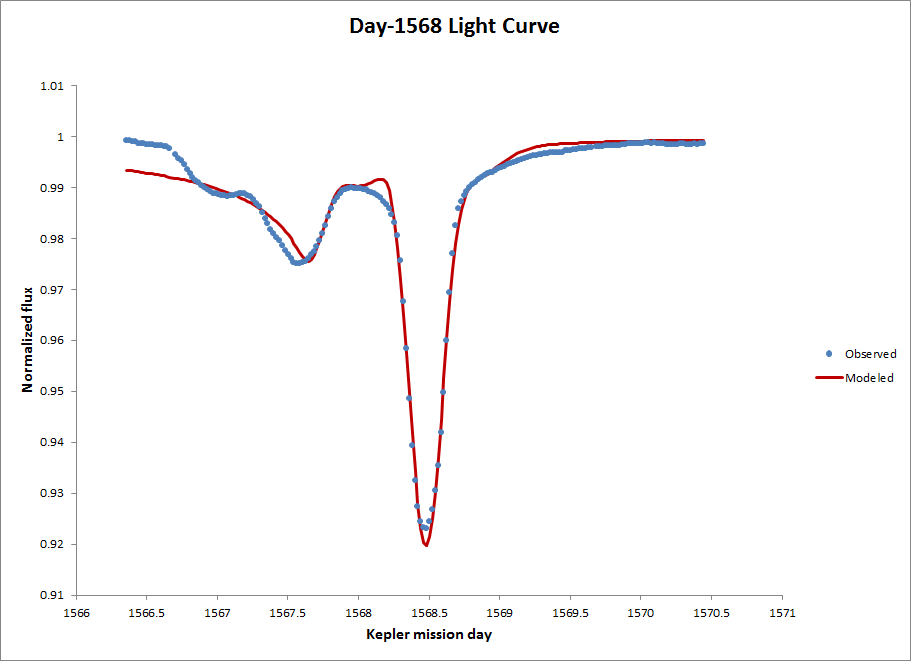
Day-1568 Drop
I modeled the third-largest drop in a similar manner. This is a considerably smaller drop than the other two. The fit is good (RMSE ~ 0.0023) but there is not a lot of variance in the light curve.
Conclusion
I have proposed a type of model that is mathematically simple and, with slight variations, is able to produce excellent fits for all the major brightness drops observed in Tabby's star. If this is the correct type of model — its goodness of fit is highly encouraging — the following hypotheses should be considered:
1) Tabby's star has one ore more partially constructed Niven Rings. All partial rings are likely in the same orbital plane and possibly the same orbit.
2) Tabby's star hosts a Dyson Swarm, and some objects in the swarm cluster alongside shared orbits, with an object distribution given by an approximation of a Monod equation. Perhaps the distribution is intentional in D800, and meant to be a beacon.
3) We might be looking at the birth of an accretion disk, or a partial accretion disk. Perhaps Tabby's star is being slowly swallowed by another star or a black hole. Perhaps there's a natural reason why disk material would approximate a Monod distribution, quite perfectly sometimes, and chaotically on different occasions.
References
Jacques Monod, 1949. The growth of bacterial cultures. doi:10.1146/annurev.mi.03.100149.002103.
Eva H. L. Bodman & Alice Quillen, 2015. KIC 8462852: Transit of a Large Comet Family. arXiv:1511.08821.
Benjamin T. Montet&Joshua D. Simon, 2016. KIC 8462852 Faded Throughout the Kepler Mission. arXiv:1608.01316.


Comments