


My view, which I've already outlined, is that the 24.2-day semi-periodicity is much more than a curiosity. It's an analytically useful tidbit of information, as recent observations make clear.
If it's indeed the case that intervals between any 2 dips are invariably approximate multiples of 24.2 days, it follows that the interval between dips produced by the same transit (an orbital period) should also be a multiple of 24.2 days. I'm confident this has been confirmed at this point.
Based on a match between a section of the Kepler light curve and dips observed from the ground with the LCO network, Sacco et al. (2017) proposes a ~1574-day orbital period. The orbital period of the D1540 group actually seems to be closer to ~1572 days based on a Pearson's cross-correlation alone. But a dip finding in 1978 Sternberg data (Hippke et al. 2017), which is best matched with D1568, suggests a much more precise period of 1574.4 days. This orbital period happens to be 1.4 days away from the nearest multiple of 24.2 days.
Coincidence? Taken in isolation, that's a statistical possibility. But the expected shouldn't be considered in isolation. It's just one more data point that confirms a pattern.
Then we have the interval between D792 and the clearest AAVSO dip so far: one observed on May 4, 2016. At ~1886.9 days, it happens to be 0.7 days away from the nearest multiple of 24.2 days. Again, this is not coincidence, but an expected result for a statistically significant dip we have no grounds to doubt is an actual dip.
There's a more remarkable aspect of this interval of 1886.9 days. It happens to be 6/5ths of the apparent orbital period of the D1540 group, with a 0.13% margin of error. The intervals are only a couple days away from a exact 6:5 resonance. Again, I don't believe this is coincidence. If you encounter a stellar system with two massive transits, we should expect to find that the transits are in different orbits and likely in near-resonance with one another.
If you only consider the similarities and differences between the D1540 group and recent LCO observations, it's easy to be skeptical of the orbital period hypothesis proposed by Sacco et al. (2017). But lines of evidence add up in science. You need to consider the 1978 dip, the 24.2-day fit, and near-resonance with the apparent orbital period of D792. What we have here are mutually confirmed expectations based on patterns that may not seem conclusive on their own.
The 24.2-day semi-periodicity is thus a useful analysis instrument. At the moment we do not have a telescope in space monitoring KIC 8462852 with high cadence. Small dips of ~0.5%, like most of its dips, will not be easy to detect from the ground. But there could be candidate dips of that depth. Analysis of the 24.2-day pattern, possibly combined with orbital resonance analysis, will be helpful not only in confirming that a candidate dip is an actual dip, but also in deciphering the orbital configuration of the system in a reasonable amount of time.
Prior Work
Collins and Hale (2017) used a graphical method to argue in favor of the significance of the 24.2-day semi-periodicity. Using a 24.2-day fold of the light curve, they argued that dip clustering was clear and unlikely to be the result of random chance. A possible challenge to this analysis is that if you look at many different periodicity hypotheses, you are bound to find a subset that presents unusual dip clustering.
Jason Wright reports running 10,000 simulations of 6 dips drawn at random, and looking for periods that fit dip intervals at least as well as what we see in Kepler data. He found better coincidences ~15% of the time.
Analysis - Random Dips
I will look at the 6 biggest transits from Kepler, as opposed to dips. What I mean by this is that I will rely on Sacco et al. (2017) and consider the group of dips starting around Kepler day 1480 (the D1540 group) as a monolithic group. It could be a single transit or a group of transits orbiting in formation, but there's no reason to think they should follow the 24.2-day pattern among themselves. The separation between D1519 and D1568 is ~49 days. This is close enough to 48.4 days to make us think the pattern is held, but I believe it's incidental. Indeed, once you look at Elsie and Angkor, the pattern no longer holds.
I should note D1495 fits the pattern, but to keep the methodology consistent, I will exclude it from analysis. Going forward, however, D1495 should be thought of as a dip produced by a transit independent of the D1540 group.
The dips I will include in analysis are therefore D140, D260, D359, D792, D1205, and the D1540 group.
How to estimate the centroid of the D1540 group is unclear. The options I've considered are (1) the timestamp of the D1540 minimum, and (2) the average of timestamps of D1519 and D1568. The second one works considerably better than the first, but I will start with the first assumption, so the analysis isn't biased to begin with.
I ran 2,000 simulations where I drew 6 dips from a uniform distribution of a timestamp domain equivalent to Kepler's. Then I iteratively searched for a divisor of the interval between dips 1 and 6 that fits intervals of consecutive dips at least as well as what we see in actual data.
The idea is that we are bound to find a divisor that fits dip intervals, but it will typically be smaller than 24.2 days. We want to find out how often the divisor is 24.2 days or better.
The interval error will be defined as follows: Given r, the ratio between an interval and the tested period, the interval error is abs(r - round(r)). The range of the interval error is therefore 0 to 0.5.
Let's start by looking at periods produced under the constraint that the maximum interval error should be 0.14, which is what we see when the D1540 minimum is used as the centroid of the D1540 group. In this case we find that ~13.4% of suitable periods are 24.2 days or more.
That's hardly reassuring, but there's something we've failed to consider. The 0.14 interval error could be an outlier. The distribution of errors matters. They are 0.013, 0.068, 0.033, 0.12 and 0.14. We should look for periods that fit intervals with a maximum error of 0.14 and at most an average error of 0.075. Under these constraints we find that only ~8.95% of suitable periods are 24.2 days or more. A histogram helps visualize how this works.

We haven't technically reached statistical significance, but keep in mind there's evidence we haven't considered in analysis, such as the apparent orbital periods of the D1540 group and D792, the D1495 dip, and smaller dips that also roughly fit the pattern, such as D426 and D502.
Now, let's see what happens if we define the centroid of the D1540 group as the average of D1519 and D1568. Interval errors are now 0.026, 0.057, 0.079, 0.075 and 0.027, with an average of 0.0529. Under these new constraints, only ~1.05% of simulations produce a period that divides intervals as expected or better.
By slightly changing how the centroid of the D1540 group is defined, the probability of a chance finding has dropped by an order of magnitude.
Analysis - Orbital Resonance
Dips in the real world aren't drawn at random from a uniform distribution, so I also analyzed dips produced by simulated orbits in resonance with one another.
If orbital periods are produced by multiplying a random ratio with a previously generated period, the results are not convincing. Only ~8.1% of simulations reproduce our pattern or better, if all transits start out aligned. The angular vantage point of the observer is random.
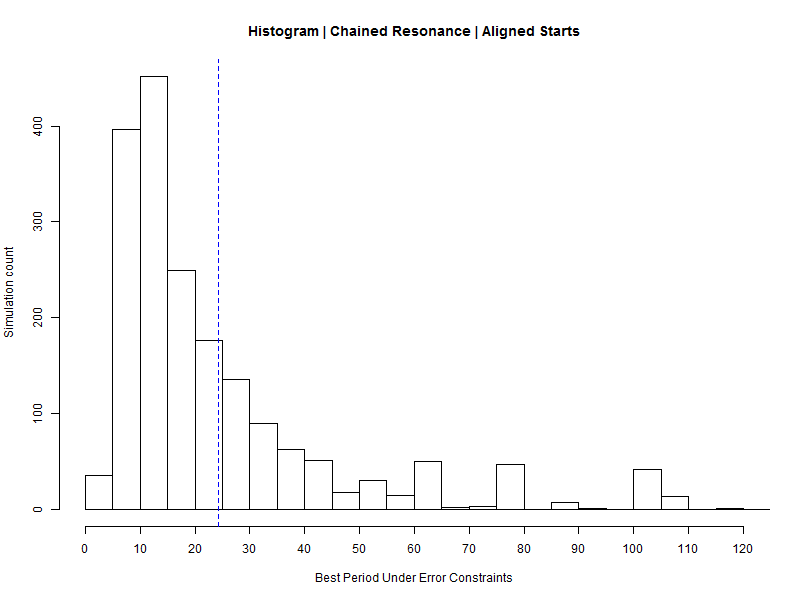
I get more interesting results with a chained orbital resonance pattern I've previously discussed, where orbital periods are defined as follows:
p(n) = 314.6 * n days
I use 10 transits at p(3) to p(12) in order to reproduce the average 6-dip interval we see in Kepler, and let the simulation run for a while before selecting the test dips. Under this model, when transits start out aligned, ~36% of simulations reproduce our pattern or better. The corresponding histogram tells the story.
It's not necessary that transits start out aligned. If you delay them incrementally at intervals of 90°, the probability of a chance finding only drops to ~25%.
Would such a chained orbital resonance configuration be unusual? I believe it will turn out to be more unusual than TRAPPIST-1's. I have other reasons to say this, but that's an analysis for a different time.
References
Boyajian, et al. (2015). Planet Hunters X. KIC 8462852 - Where's the Flux? arXiv:1509.03622
Andrew Collins and Rodney Hale (2017). KIC 8462852—Windows of Opportunity: Cyclic Periodicities, Light Dimming Episodes and the Star’s 0.88-day Rotational Period. http://vixra.org/pdf/1708.0292v1.pdf
Hippke et al. (2017). Sonneberg Plate Photometry for Boyajian's Star in Two Passbands. arXiv:1609.09290
Sacco et al. (2017). A 1574-day periodicity of transits orbiting KIC 8462852. arXiv:1710.01081


Comments