

As I described in the two previous posts, (where I discussed the recent measurements of the Bs->μμ decay and the Bd one) when you look at rare decays of heavy mesons which occur within the Standard Model thanks to quantum loops of virtual particles, you get sensitive to possible new physics effects - new particles that circulating in those quantum loops may produce a visible deviation of the decay rate or kinematical characteristics with respect to what is expected.
In the case of the B -> K* μμ , with the K* decaying to K and π, a deep study of the angular distributions expected for the decay products has been carried out by theorists in the recent past. It appears that new physics effects could make themselves felt especially in some angular distributions. So LHCb measured a complete basis of these kinematical variables describing the decay, and found a generally good agreement with SM predictions, except in one or two of the investigated regions of q-square -the square of the four-momentum transfer, another kinematical variable I won't describe for you today. Let us instead focus on the LHCb observation and the interpretation of the effect.
The most discrepant measurement, with respect to SM predictions, appeared in a variable called P5', at low q^2. LHCb in a talk given at EPS by Nicola Serra, quantified the discrepancy as a 3.7 standard deviations effect, and - taking into account the fact that many other bins and other variables had been studied, quantified the effect as a p=0.005 one - a "2.8 sigma effect".
A very interesting interpretation of this discrepancy and the other measurements, which many seem to hope is finally a definite sign of new physics making its appearance in low-energy processes, has been readily produced in a paper appeared a couple of days ago, by S. Descotes-Genon et al. The paper correctly takes in consideration all of the measured quantities by LHCb, and not just the odd ones; and it adds many other measurements of observables in similar decays that can bring in information on the phenomenology of these rare processes and their angular characteristics.
In a table in their paper they compare theoretical estimates to experimental determinations for 47 different measurements, producing a list of "pulls" - discrepancies in units of standard deviations. Of course, the 4.0 sigma result - 3.7 according to the talk by N.Serra I cited above- sticks out, but how significant is it, really ?
We already know the LHCb answer: an equivalent 2.8 sigma effect. Not extremely rare for a fluctuation, but still quite an important effect. But the availability of all 47 measurements gave me the stimulus to make an exercise today. Leaving aside all the discussions on whether, in the presence of one odd result and 46 reasonable ones, one should concentrate on the former, or "dilute" its significance by a straight x47 trials factor, or rather try to combine all p-values in some smart way - there are dozens of possible ways of doing that, and I guarantee they provide dozens of corresponding different answers -, here I want to make a different exercise, based on some literature on the matter of measurements of particle properties I have recently been making.
As you might know, the Particle Data Group is a venerable institution that in the course of the last 50 years has kept track of all measurements of elementary particles performed by physicists. The Review they publish annually is a thick 1500-page book written in small font, containing all our knowledge of particles masses, lifetimes, decay modes, etcetera, etcetera. Of course, the PDG computes averages of all measurements of particle properties. They do so by the well-known method of weighted average: each measurement is considered to "weight" in a way inversely proportional to the variance they estimate for their determination. In other words, if experiments A and B measure the same quantity x, and A claims to measure x with an uncertainty twice smaller than B, the estimate for x is <x> = (4A+B)/5, that is an average that weighs A four times as much as B. Formulas for the weighted average can be found in every textbook or on wikipedia.
After many years of doing averages, the PDG realized that physicists often end up quoting uncertainties which are underestimated. We are talking about difficult measurements, so this is not really a blemish: sometimes it is not a fault in the measurement, but the use of an incorrect theoretical input; other times, it is just the lack of knowledge of some still-unknown effect that influences the measurement.
A group of researchers studied hundreds of the reported measurements, and ended up with a rather interesting find (M.Roos, M.Hietanen, and J.Luoma, "A new procedure for averaging particle properties", Physica Fennica 10, 21-33, 1975): they observed that the distribution of the errors on the measured quantities was not a Gaussian of width equal to the claimed error, but rather, a Student t distribution S_10(t/1.11). What is a Student t distribution ? It is a Gaussian with longer tails, basically. S_1 is the Breit-Wigner distribution, and S_infinite is a Gaussian; so the larger the subscript of S, the more the curve resembles a Gaussian.
What all that means is that when one looks at a Physics measurement of particle properties of the past, one should interpret discrepant results with some caution: S_10(t/1.11) has wider tails than a Gaussian, so discrepant results are more likely than what the conversion of Gaussian tail areas to p-values would imply.
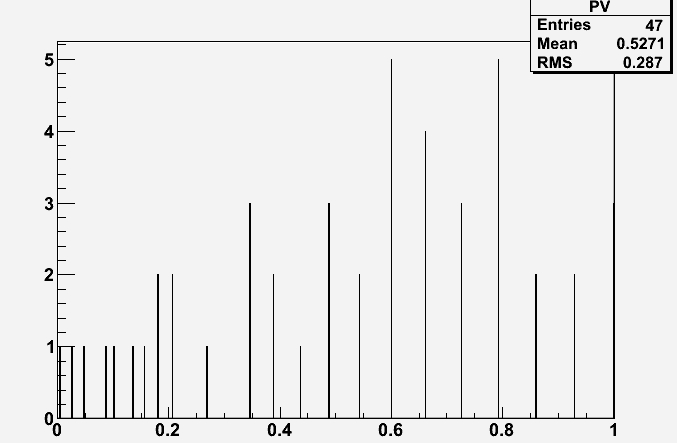
I decided to test the list of pulls by assuming that particle physics experiments nowadays are no different, in their measurement of meson parameters, from experiments of the past studied by Roos et al. So I took the 47 pulls in the paper quoted above, and produced the corresponding p-value assuming that the measurements distribute according to a Student t distribution S_10(t/1.11).
The result is that the 4.0 sigma corresponds to a probability of 0.0048, before any trials factor is considered. The other 46 results of course have larger p-values. Below is their distribution, in a graph. You will notice, by the way, that the average of the 47 results is 0.527, so very close to 0.5 (as expected for p-values drawn from a uniform distribution, without the contamination of some new physics ruining the agreement and causing a skew toward low p-values), and the rms is 0.287, when for a flat distribution one expects 1/sqrt(12) = 0.289 ! So these p-values are overall coming from a really flat density function, if we believe the results of Roos et al...
Does all the above change the conclusions one could have drawn from the beginning ? Of course not. A single very discrepant measurement in 50 is not so rare, and even if it were... Well, this is particle physics, so our measurements are always difficult to carry out. Unknown systematic effects are always lurking, and we cannot always account for them.
As for the Roos et al. recipe, you might wondering what the PDG eventually did of it. In the 1976 edition of the review, and in few later ones, the PDG started quoting two different weighted averages of particle properties, one using the recipe of Roos et al. and the other using the common weighted average (scaled, when inputs are discrepant, by a common scale factor on the uncertainty - a recipe I have discussed here elsewhere). Eventually, though, it was probably felt that the recipe was too "ad-hoc", and that measurements of particle properties in the eighties were becoming more of a precision business, so the technique was abandoned. I wonder if somebody is considering redoing the study of Roos et al. using all the PDG Review data, instead than just meson masses and lifetimes...


Comments