

The B_s meson decay to muon pairs has been one of the most appealing channels to search for effects of new physics in the last decade: all experiments having some chance to observe it have repeatedly tried to spot it. Theorists had insisted a lot, in fact, on the possibility that new physics would first be spotted in this rare process.
The B_s meson is a particle made up by a anti-b quark and a strange quark. It has zero net electric charge, so in principle it can decay to a pair of muons; but in order to do so, the two quarks must somehow "annihilate", and they can only do that if one of them turns into the other's antiparticle. Now, the strange quark can become a b-quark only by first turning into a (virtual!) up-type quark (among the three possibilities -[u, c, t]- the top quark is actually the best option). It does so by a "charged current" process, which is mediated by the weak W boson. Once a top quark is produced by the W emission, the conversion into a bottom quark requires one further W boson interaction. The bottom quark can finally annihilate into the anti-bottom; this produces a photon or a Z boson, which can materialize in the muon pair we need to have at the end.
Note that the two W bosons emitted in the intermediate steps described above do not end up producing particles in the final state: we are considering the decay b_s --> μμ with nothing else. So the two W bosons belong to "internal loops" in the decay diagram. A sketch will clarify matters:
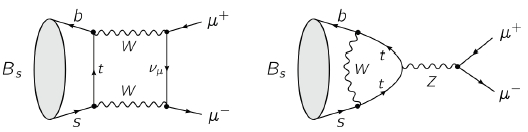
Above you see two possibilities for the reaction (they are not the only ones). On the right is one similar to that which I have discussed in detail: the strange quark in the bottom line turns into a top by emitting a W; the same W is reabsorbed at the other vertex above to change the top into a b. Here it is the top-quark line which emits the Z boson, and that may be seen as the "annihilation" point; but this is only a qualitative description - the Z boson can be emitted at any point along the quark line which connects the s at the bottom with the b at the top (and in fact I believe the emission of the Z by a down-type quark is more probable, given the larger coupling of the Z to those).
On the left, the Bs chooses another way to produce the two muons: this time the two W bosons directly connect the initial quark line with the final muon line. At each of the vertices on the right of the left diagram, the W "produces" a muon-muon neutrino pair. The neutrino "connects" the two, and the final particles are again two muons. I believe that the diagram on the left has a smaller relative amplitude, but let's forget again this detail.
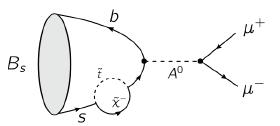 Instead, let us look at what might happen if one hypothesized the existence of new particles like SUSY ones. One would then have to admit that the reaction shown on the right occurs (remember the rule: everything that is not forbidden, is mandatory in the quantum world!). So the chargino-stop loop on the bottom part of the diagram allows the quarks to annihilate, and the mediator is now an A0, a CP-odd Higgs boson -one of the five higgs bosons that are present in SUSY theories (at least five, that is). It is not granted that the addition of one diagram like the one on the right increases the total probability of the decay to muon pairs, but typically this is the outcome. So in most versions of SUSY, the Bs should have a larger branching fraction to muon pairs than what the Standard Model predicts.
And what do the LHC data say ? CERN physicists have combined the searches produced by ATLAS, LHCb, and CMS in a tight upper limit of the branching ratio. The data samples can be seen in the pictures below: ATLAS,
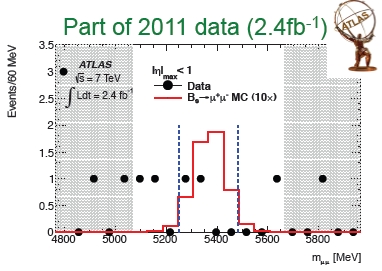
where you see the data as black points (only zeroes and ones), and a Bs signal from simulation in red overlaid after multiplying it by ten times the SM prediction; LHCb,

where you see the search regions for the two separate searches of B_s and B_d decays (but I will not discuss the latter, which is even more rare than the B_s and a less sensitive channel where to observe new physics). The grey area is the expected signal, the brown is the background, and black points represent the data; and CMS:

CMS separates the Bs and Bd searches in a "barrel" region and a "endcap" region, where the former means that both muons are detected in the central detector region, where there is more sensitivity and better resolution. The horizontal bars show the search region in the mass distributions.
The combination of the above data uses a likelihood ratio test statistics and the CLs criterion for producing the actual 95% CL upper limit; but I will spare you such irrelevant details. What you want to know is the result and how it compares with Standard Model predictions.
So the SM prediction says that the Bs should decay to muon pairs thirtytwo times every ten billion decays (B=3.2x10^-9). What can be said from the data is that the decay occurs with a rate of less than 4.2x10^-9, with a 95% confidence level. In other (approximate) words, any new physics contribution to the rare decay is constrained to be much smaller than the SM contribution.
Model builders are certainly already updating their graphs to check what regions of the parameter space are still alive after the new data. Some have even already produced them: a May 28th 2012 arxiv preprint by David Straub, for instance, contains the following figure:
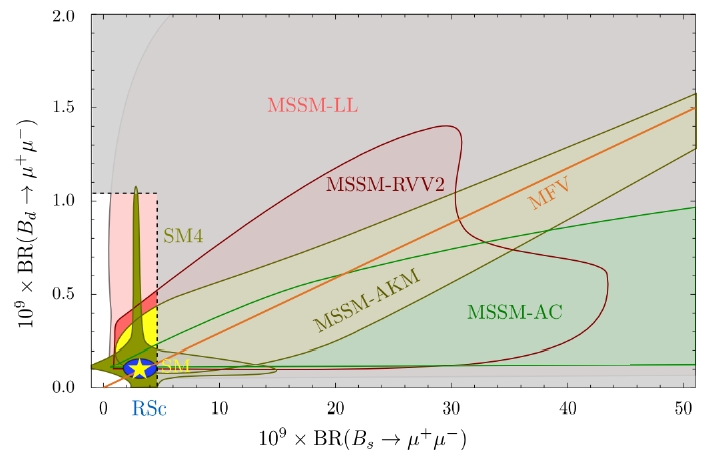
This is hard to decypher if you do not know what all those acronyms mean, but let's forget about them. What matters is that you see that on the x axis there is the Bs->μμ branching fraction, and on the y axis the Bd->μμ one. The experimentally allowed region of the parameter space is the small corner still not greyed out in the bottom left. The star represent the Standard Model prediction, which is well in the allowed region of course; while the various Minimal Supersymmetric models depicted in the graph are close to being killed by the experimental constraints. The SM4 still survives well (it is a Standard Model enlarged with a fourth generation of matter fields), though.
As I said at some point above, SUSY is not going to be killed by the Bs and Bd searches, since in some combinations the virtual loops can actually cause no observable variation of the SM branching fraction; however, it is certainly true that these results are a further sizable objection to your believing that SUSY is the correct theory to extend the Standard Model. But you can certainly take refuge in the belief that only one is the "true" set of SUSY parameters, and that excluding all other sets does not make that less probable. It depends on your prior beliefs.


Comments