Jordi Duch, Joshua S. Waitzman and Luís A. Nunes Amaral of Northwestern University say they may have an answer.
How so? The impact of a player like Robinho of Brazil or Landon Donovan for the US is obvious yet somehow great teams, as we all know, are more than a sum of their individual parts(2) but darn hard to quantify because, unlike baseball, scores are low, assists are low, shots are low. The value of a player might be 'hidden' in a statistics sense because there are few statistics and so could lead to wild results.
If you are a fan of the NBA's Los Angeles Lakers, you know what I am talking about when I say soccer is a 'triangle', because Phil Jackson teams have made their entire dynasties on the concept of moving the ball in a triangle and soccer teams do the same thing so the researchers created a directed network of “ball flow” among the players of a team, where the nodes represent players and arcs are weighted according to the number of passes successfully completed between two players.
Then they added non-player nodes for shots, those being 'shots on goal' and 'shots wide'. They connect the player's node to those non-player nodes by arcs weighted according to the number of shots.
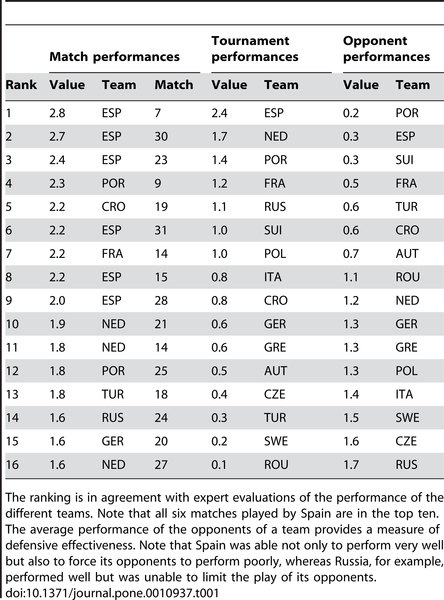
There you have it - a flow network for each team. And then they did that for all of the teams in the Euro Cup 2008 tournament. By combining their flow network with the passing and shooting accuracy of the players, they were able to create what they call a natural measure of performance of a player, factoring in defensive efficiency by letting each player start a number of paths related to the number of balls that he touches during the match, much like number of chances in baseball.
In their predictions using that model, they found that teams with a 'performance' rating of greater than 0.75 (go here to see the entire equation) had 3:1 odds of winning if their rating was higher. This corresponded to the strong performance by Spain in that tournament.

Know what else is collaborative yet very difficult to quantify individual value in? Science. As we continue to move into a Science 2.0 world, old techniques (location of names on a study in citations) will not be able to identify the researchers with the most important roles during the studies.
Instead, a flow centrality metric like this could be a way to quantify the contribution of individuals for teams working on large projects like the LHC or large biology studies. Obviously it is difficult to quantify skills and capabilities of individual scientists - if you think 'scores' in soccer games are low, imagine how low they are in science - but assigning a value to completion of specific tasks might allow a way to quantitatively assess the individual performance of the project contributors and their contribution to the overall study.
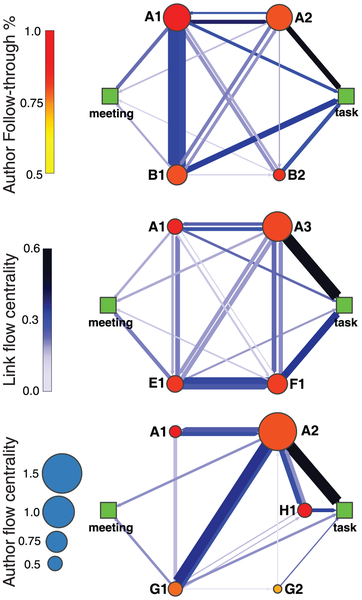
And the researchers have already done some of the basic Science 2.0 ' proof of concept' work for us - using tasks they had to do for their study. They don't tell us among their group who the Ronaldinho and who the ... well, name anyone on England when it is time to take a penalty shot(3) ... is. We just have codes for names.

Visualization interactions between co-authors for the three papers the researchers published. The letter in a node's label distinguishes labs and the number distinguishes researchers within a lab. A node's label remains constant across projects and position is chosen for clarity of the representation. Nodes are color-coded by the z-score of the follow-through of the co-author, and sized according to the individual's flow centrality. The width of the arcs is proportional to the number of communications directed from one co-author to another, whereas the color indicates the arc flow centrality.
Scientific research is wonderfully complex but this sort of network analysis method could be a starting point for learning about quantifying individual performances in a science collaboration setting.
This would allow researchers who are responsible for methodological injections of creativity into a large collaborative process to get recognition without adopting a 'me first' attitude.
Citation: Duch J, Waitzman JS, Amaral LAN (2010) Quantifying the Performance of Individual Players in a Team Activity. PLoS ONE 5(6): e10937. doi:10.1371/journal.pone.0010937
NOTES:
(1) Defense being the exception. Though experts 'know' someone is good on defense, casual fans cannot. Since errors are assigned by the home team scorekeeper (meaning the home team will get fewer) and range is entirely subjective, the value of defense is unclear in baseball but it has gotten better, since we can have some idea of 'range' - the field is a size we can define - so we at least know a shortstop with a .990 fielding percentage and no errors is not better than one with .940 and 6 errors who has a lot more chances and putouts.
(2) And some teams can't, which is why, prior to John Terry impregnating another player's girlfriend and getting his captain's armband lifted, I thought England would be coming into another 'golden age' but it is more likely to be another year where they have great players and win nothing.
(3) Don't even write me and complain. We both know I am right.


Comments