

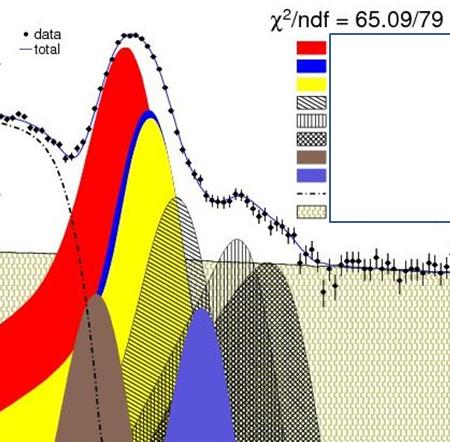
More advanced readers may know at a glance what this plot is and where it comes from. To them, I ask the favour to wait one day (to not spoil the game to the less knowledgeable users) before trying a harder challenge: by heart, explain the meaning of every single distribution shown -e.g. provide the correct key of the masked legend on the right.
Please do not be shy and shoot your answer in the comments thread, even if you know your tentative answer has no chance of being the correct one - remember, it is all to the benefit of the popularization of science!


Comments