

Suppose you are given two measurements of the same physical quantity. Make it something easy to visualize, such as the length of a stick. They tell you that when measured with method 1 the result was x1=10 cm, with a estimated uncertainty s1=0.1 cm, and when measured with method 2 the result was x2=11 cm, with estimated uncertainty s2=0.5cm. Here is a question for you today: What is your best guess of the length of the stick ?
To make things interesting, let me give you a few possible answers from which to pick. We will discuss it later which is the correct one, and this will allow us to shed some light in the whole matter. Unless your knowledge of basic Statistics is above that of an average graduate student in Physics, you will be surprised, I guarantee it.
- Anything between 10 and 11cm, I do not care to make the exact calculation but it is obviously trivial and I can't be bothered with such trivial details.
- 10 cm, the result with the best stated accuracy
- 10.5 cm, the linear average of the two measurements
- The best estimate is L*=[10/(0.1^2)+11/(0.5^2)]/[1/(0.1^2)+1/(0.5^2)] cm, which is of course the weighted mean of the two measurements, with weights equal to the inverse variances.
- Not possible to answer, unless some more information is provided about the stated accuracies.
- Something between 10 and 11 cm, whose exact value depends on details which were not disclosed in the statement of the problem.
Which is the answer you'd take ? Let me guess that you (most of you, I mean) are oscillating between (4) and (6). That is, you have been taught that the weighted average is the correct way to go, but you suspect that there would be no point in this article if that were the correct answer. So you might actually end up choosing (6), which appears the most foul-proof answer.
However, the correct answer is (5). You cannot make the correct average of the two measurements unless you know the amount of correlation between the two uncertainties - in layman terms, how much the two measurement errors depend on one another. And here is the "surprise" bit: you are not even guaranteed that the best estimate of the true stick length lays between the two measurements!
To see this, we should fiddle with the math behind the method of least squares -or equivalently, with a maximum-likelihood expression of the problem. I am going to explain the bare bones of the method in the section below, but if you loathe math or if you are not really in the mood of following complicated expressions, you are advised to skip it completely and go to the following section, where you will be convinced that the true answer is (5), and get close and personal with even more startling results, by means of a purely geometrical construction. Further down you also find a practical proof that even a fifth grader could understand. In other words, this article is built upside-down: from hard to easy! I hope it is not too confusing...
The method of least squares
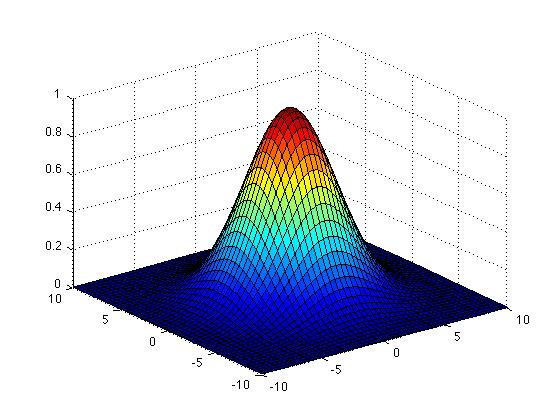 In the case we are considering, the method of least squares allows you to find the best estimate L* of the true value L (length of the stick) in case you have a set of n measurements y_i of it, which are assumed to distribute according to a n-dimensional Gaussian (if you do not know what a n-dimensional Gaussian is do not worry: we will be making just the two dimensional case here, and in two dimensions you can easily visualize a Gaussian as the hump shown in the graph on the right). The method assumes also that you know the expression of the covariance matrix of the n measurements, V_ij (the covariance matrix contains the squares of the errors in the measurements -the individual variances- as diagonal terms, and terms describing how the measurements depend on one another in the off-diagonal positions; we will get to that later). The expression
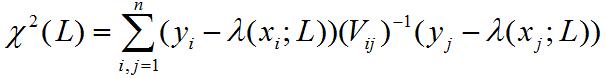
is then "asymptotically distributed like a chisquared". What the jargon between quotes means is that for large n the sum approximates a functional form called chisquare distribution: ignore the specification, it is of no use for us today. What is important is that the maximum value of the expression is obtained at a value L* which is called the least-squared estimator of L: it is an estimate of the true value of the stick length which has several good properties (which again I won't discuss here).
Let us write down the general expression of V in case of two measurements y1, y2:
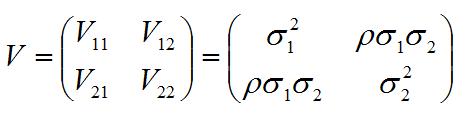
The letter rho in the expression indicates the correlation coefficient, and the sigma are the standard deviations -their squares are called variances. If you find the inverse of V (i.e. the matrix which multiplied by V gives the identity), plug it into the expression of the chisquared above, and proceed to find the point where the derivative of the chisquared over L nullifies, you will obtain the value of L*:
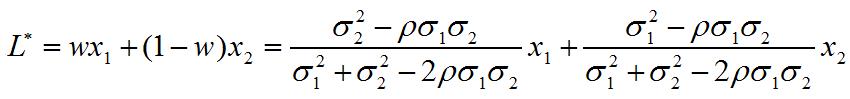
This is still called a weighted average, although more complicated than the expression you are probably familiar with (the one at point (3) in the list of answers above). The weights are w and 1-w. The (inverse) variance of this weighted average can be written as
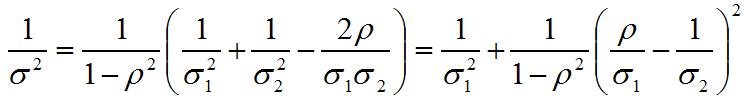
and from this expression we see that once we take a measurement y1 of variance v1, any second measurement of the same quantity will reduce the variance of the average (i.e., our knowledge of the unknown stick length will improve by considering the average of the two measurements) unless the correlation coefficient rho equals the ratio sigma_1/sigma_2.
But what happens if rho>sigma_1/sigma_2 ?? In that case the weight w gets negative, and the weighted average L* we have written above goes outside of the "psychological" bound [y1,y2]. The reason for this behaviour is that with a large positive correlation the two results y1, y2 are likely to lie on the same side of the true value! On which side ? The one where the measurement with the smallest variance lies!
How can that be ?
It seems a paradox: you take a measurement of the stick length, get y1, and then somebody tells you:
"Here's another method to measure the length. It will give a result, y2, partly correlated with the one you got. Please try it, but beware: if the stick is shorter than y1, this other method will most likely give you y2>y1, i.e. tell you that the stick is longer than y1; while if the stick is longer than y1, you will most of the times get y2<y1."
Your reaction might be "WTF -your other measurement makes no sense to me!". But it does make sense, and averaging (in the correct way!) y1 and y2 will improve the accuracy of your combined result.
The problem is that we are not accustomed to deal with measurements with large correlation among them: it goes beyond our intuition. Here is a dialogue between John and Jane which should shed some light in the issue.
John vs Jane
John: "I took a measurement, got x1. I now am going to take a second measurement x2 which has a larger variance than the first. Do you mean to say I will more likely get x2>x1 if L<x1, and x2<x1 if L>x1 ??"
Jane: "That is correct. Your second measurement 'goes along' with the first, because your experimental conditions made the two highly correlated and x1 is more precise."
John: "But that means my second measurement is utterly useless!"
Jane: "Wrong. It will in general reduce the combined variance. Except for a very special case when the correlation coefficient is equal to the ratio of standard deviations of the two measurements, the weighted average will converge to the true L. Least-squared estimators are consistent !!"
 John: "I still can't figure out how on earth the average of two numbers can be ouside of their range. It just fights with my common sense."
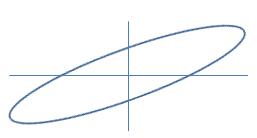
Jane: "You need to think in probabilistic terms. Look at this error ellipse (see graph on the left): it is thin and tilted (high correlation, large difference in variances)."
John: "Okay, so ?"
Jane: "Please, would you pick a few points at random within the ellipse?"
John: "Done. Now what ?"
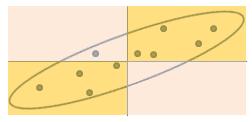 Jane: "Now please tell me whether they are mostly on the same side (orange rectangles) or on different sides (pink rectangles) of the true value."
John: "Ah! Sure, all but one are on orange areas! (See graph on the right)".
Jane: "That's because their correlation makes them likely to 'go along' with each other. And I can actually make it even easier for you. Take a two-dimensional plane, draw axes, draw the bisector: the latter represents the possible values of L. Now draw the error ellipse we have just seen around a point of the diagonal. Any point, we'll move it later."
John: "Done. What next ?"
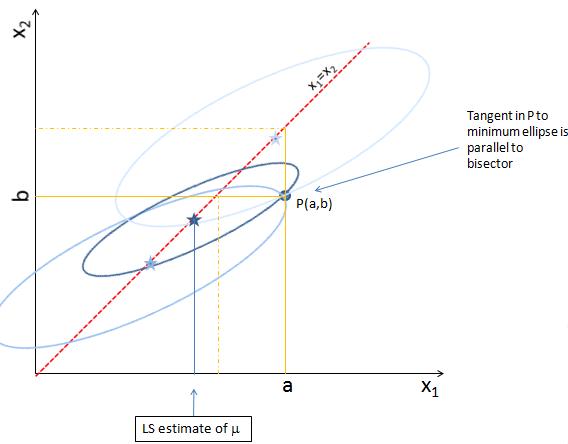 Jane: "Now enter your measurements x=a, y=b. That corresponds to picking a point P(a,b) in the plane. Suppose you got a>b: you are on the lower right triangle of the plane. To find the best estimate of L, move the ellipse by keeping its center along the diagonal, and try to scale it also, such that you intercept the measurement point P."
John: "But there's an infinity of ellipses that fulfil that requirement!"
Jane: "That's correct. But we are only interested in the smallest ellipse! This is the one which has a tangent in P(a,b) which is parallel to the diagonal in the graph. Its center will give us the best estimate of L, given (a,b), the ratio of their variances, and their correlation."
John: "Oooh! Now I see it! It is bound to be outside of the interval!"
Jane: "Well, that is not true: it is outside of the interval only because the ellipse you have drawn is thin and its angle with the diagonal is significant. In general, the result depends on how correlated the measurements are (how thin is the ellipse) as well as on how different the variances are (how big is the angle of its major axis with the diagonal)."
Try it yourself!
If the above discussion does not convince you that the best estimate of a unknown quantity you have measured with two correlated methods may fall outside the range of the two results, I have another way to try forcing it into your brain, and it might actually be fun. You will need a square table on which to perform your measurement, a stick to be measured, a ruler, and another long rod.
First of all, measure the stick as accurately as you can with the ruler (using a ruler with smaller divisions would be a good idea): x. This will be your "true value" of the stick length. Then you proceed to set up two correlated measurements of the stick length in a rather funny way. First, place the rod on the table such that it looks orthogonal to the edge of the table on your side, and at a distance a few inches longer than the stick length from the right side of the table. Please do not make the orthogonality requirement a too strict one -a small tilt will make things more interesting. Fix it with tape in that position. Now measure as accurately as you can (use the more precise ruler if you have it) the distance along your side of the table from the right edge of the table to the point where you fixed the rod, and call it y.
Using a pencil and the ruler, now mark on the table two set of points at, say, five and fifteen inches from the edge of the table, in order to allow locating the stick in a way it is parallel to the edge of the table.
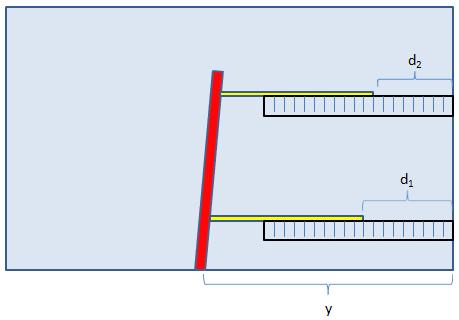
Finally you perform your measurements by placing the stick (in yellow in the figure above) such that it passes precisely by the two "five inch" marks and then the "fifteen inch" marks. Each time, you move the stick toward the left until it hits the rod (in red), and then fix it there. Then with the ruler you measure the distances, d1 and d2, between the right edge of the stick and the right edge of the table. Don't make these measurements very precise, for added fun.
From the way you have performed your measurements, your estimated stick lengths will be x1=y-d1, x2=y-d2. These two measurements are subject to some degree of random error inherent in the process of reading off the length on the ruler, and other methodological issues; but the largest effect is probably that they are correlated because the rod on your left is not exactly orthogonal to the edge of the table. And of course, x1 will be more precise than x2, because it suffers less from the non-orthogonality.
Now compare x1 and x2 with x, the true value of your stick's length. You should either find x<x1<x2 or x>x1>x2. Which one depends on whether your "orthogonal" rod is tilted toward the left or toward the right. In both cases, however, x1 is closer to the true value x, as we have been discussing: the large correlation between the two measurement errors makes the true value most likely to lie on the side of the higher-accuracy measurement.
And if that, too, does not convince you... I give up!


Comments