

The measurement is described in detail in a paper which explains the combination procedure (not trivial, since there are a number of systematic uncertainties that are partly correlated between the experiments). The Tevatron inputs are as follows:
CDF Run I (107/pb, 1.8 TeV): M_W = 80432+-79 MeV
CDF Run II (2.2/fb, 1.96 TeV): M_W = 80387+-19 MeV
DZERO Run I (95/pb, 1.8 TeV): M_W = 80478+-83 MeV
DZERO Run II (5.3/fb, 1.96 TeV): M_W = 80376+-23 MeV
You will easily notice that CDF consistently beat DZERO in this precision measurement; in fact, not only are its determinations more precise both for the pre- and post-2000 runs, but the most precise measurement is based on just 40% of the data used by DZERO. Of course, the W boson mass measurement is a systematics-limited one, so data size count relatively small in the post-2000 determinations. In fact, the largest single source of error is due to the knowledge of parton distribution functions in the proton. Were it not for those, the W boson mass would be known to less than 10 MeV uncertainty, while it is in fact 15 MeV now. But let's not anticipate more. When the four determinations are averaged, properly accounting for correlations, the result is
Tevatron average: M_W = 80387+-16 MeV
which is a 0.02% relative uncertainty on this important SM parameter. If we add the "W boson factory" LEP II average, itself resulting from the four determinations of ALEPH, DELPHI, L3, and OPAL, we do not move the above result by much: funny how the most important LEP II findings (precise W boson mass, 114 GeV lower mass limit on the Higgs boson) have quickly become almost irrelevant! Indeed LEP II quotes
LEP II average: M_W = 80376+-33 MeV
and averaging with the Tevatron result we get
M_W (world average) = 80385 +- 15 MeV.What I think is nice, now that we also know very well the value of the Higgs boson mass, is to compare the Standard Model consistency in the famous "MW - Mtop plot". This is a graph where the horizontal axis describes the mass of the top quark, and the vertical one the W boson mass. These two quantities are independent on each other at leading order, but they are in fact both connected to each other and to the mass of the Higgs boson, because of what is called "radiative corrections".
In short, quantum loops of virtual particles can be drawn around the "propagation" line of a top quark or a W boson. Top and W bosons readily emit and reabsorb virtual Higgs bosons, and each of them also can temporarily turn into the other (a W boson may turn into a top-antibottom quark pair, a "virtual bubble" which then annihilates back into the W; a top quark may "become" a W boson plus a b-quark, for a similarly short moment). These virtual processes "couple" the values of the mass of these particles, such that if we know the Higgs boson mass, then the top and W boson masses are one a function of the other.
The above fact implies that there exists a locus of points, in the MW versus Mtop graph, where the Standard Model is satisfied; such a locus of points depends on the Higgs mass.
Eighteen years ago we discovered the top quark, and measured its mass. We could then draw the first versions of the "Mw-Mtop" graph: an ellipse would delimit the experimental measurement of the two particle masses, and overlaid to them one could draw a family of curves (diagonal lines from the bottom left to the upper right of the graph), for Higgs boson mass values ranging from 100 GeV to 1 TeV, say.
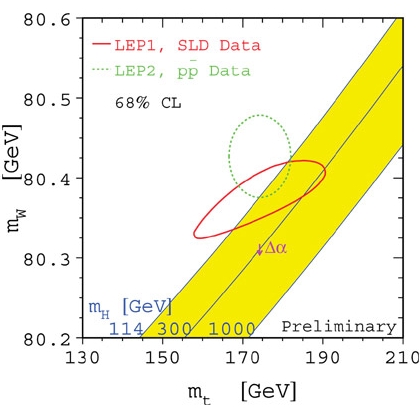 The large uncertainties in the masses of the two particles prevented us from drawing definite conclusions; roughly, one could say that the top and W mass measurements were consistent with a Higgs boson which could not be too heavy - say a 300-GeV Higgs would start to not fit the picture, but that was about it. Check out an early version of the figure on the right: I believe this was the status of things at the beginning of this century, after the LEP II measurements of the W boson mass. The green ellipse is showing the "one-sigma" region from the experimental measurements of top and W boson masses; the yellow band shows the region compatible with the Standard Model, by allowing the Higgs mass to vary from 114 GeV (the lower limit of LEP II) to 1 TeV. The red tilted oval is instead the allowed region of the parameters by indirect information coming from Z-pole measurements obtained by the LEP and SLD experiments in the nineties.
Nowadays, the picture has changed dramatically. We have "zoomed" into a much narrower mass range for both top and W boson, and the relationship between them has become a narrow line - due to the precise knowledge of the Higgs boson mass. Have a look at the figure below, which is the "money plot" contained in the W mass paper by the CDF and DZERO folks. Impressive, isn't it ? The error ellipse touches the predicted locus of points, implying that the SM prediction is verified to within one standard deviation.
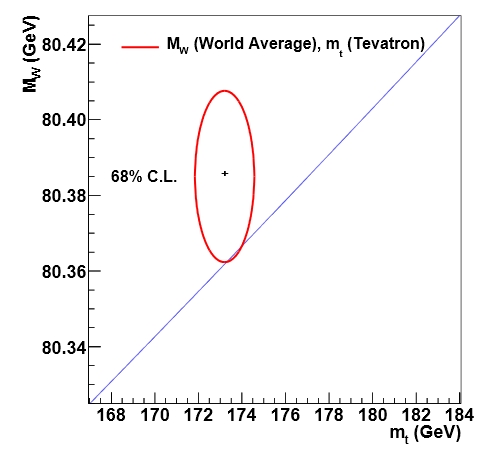
What is impressive, I reckon, needs to be stressed to be realized in full in the figure above: the figure does not look much different from the other one above, except that the x-axis scale spans now 16 GeV, and the y-axis scale spans 100 MeV; in the other plot, these are instead 80 GeV and 400 MeV, respectively - so we have "zoomed in" by a factor of 4-5 on each coordinate. And the Standard Model still rulez...


Comments