

My March 2011 forecasts were quite wide of the mark. For the first part of the Arctic summer much of the western Arctic saw lower than expected temperatures. Despite the low temperature start-off, the Arctic is about to see either the lowest ever end of season extent, or the 2nd lowest since 2007.
In June, I wrote:
Much depends on the Arctic weather, but it looks likely that the September ice minimum will be amongst the three lowest. If the melt in July and August proceeds as it has done on average over the last decade, then the 2007 record minimum may well be beaten.
The NSIDC and IJIS measure extent differently. Regardless, I expect to see both reporting a new minimum below the 2007 minimum extent. The 2007 minimum occurred 16th September as reported by NSIDC. There appears to be a slow but erratic trend towards ever later minima. On that basis, I expect the 2011 minimum to occur after 16th September. That prediction is based on the ever-thinning ice and the heat which must currently be stored in open waters. There is also the matter of the mechanical properties of ice.
I have previously remarked on a number of occasions that as the ice breaks into ever smaller floes, the mobility is increased. This means that waves and swells can penetrate further into the pack than is the case for more consolidated ice. It is also a basic fact of physics that the smaller and lighter an object is, the more rapidly it is moved by wind and wave action.
The damping action of ice on waves can be observed directly: a wave approaching ice is reduced in height as it penetrates the ice. Damping is achieved by converting kinetic energy to heat energy. Smaller fragments of ice allow that heat to penetrate further into the main pack, but smaller fragments are also more vulnerable to melting.
The effects of mechanical action on ice have mostly been overlooked by scientists, but this year an MIT study showed by considering these mechanical forces that the ice is most likely melting 4 times faster than predicted by models and is drifting twice as fast as predicted. Read more.
Ice extent and area have tracked closely the behavior of the ice in 2007 and continue to do so, as shown by these graphs from IJIS and NSIDC.
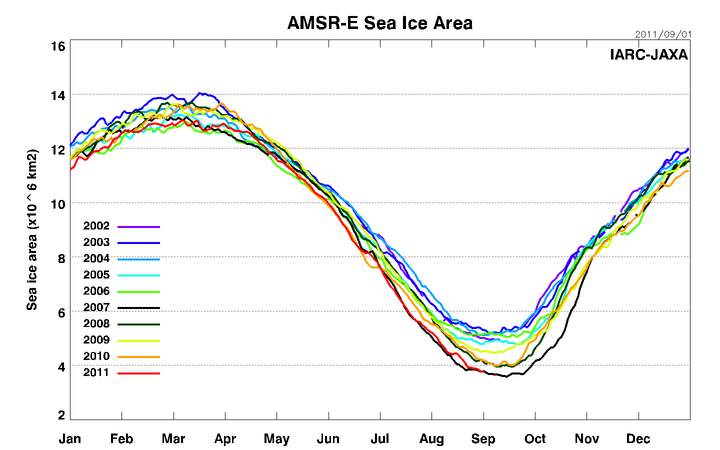
Arctic sea ice area - IJIS - Sept 01 2011
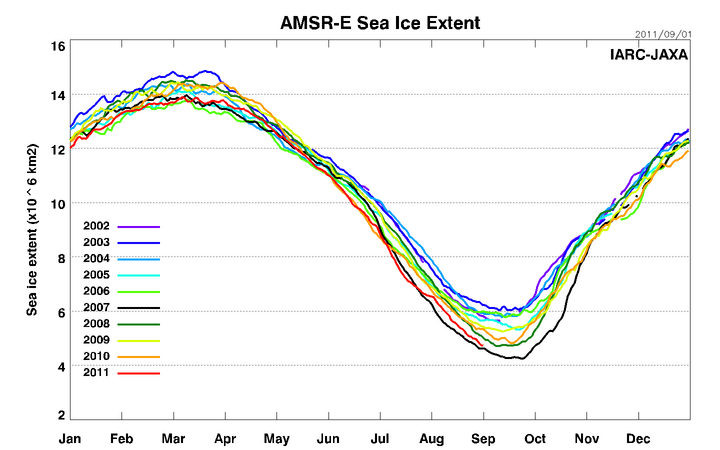
Arctic sea ice extent - IJIS - Sept 01 2011
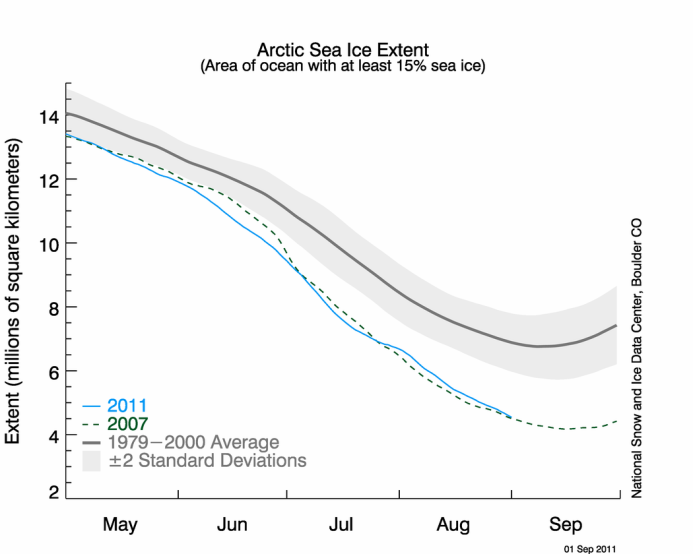
Arctic sea ice extent - NSIDC - Sept 01 2011
Area represents what would be seen if all the floes included in the extent data were pressed together so as to exclude open water. Over at Neven's blog there has been much interesting discussion of area versus extent. It is recommended reading. I will briefly state here my opinion that a more open pack - indicated where the area graph lags extent - indicates a pack more prone to melting, and vice-versa. For much of the last month or so the extent graph has lagged the area graph. Reduction in area is now only slightly ahead of reduction in extent. Accordingly, any factor tending to spread the ice out will cause a rapid further loss of ice.
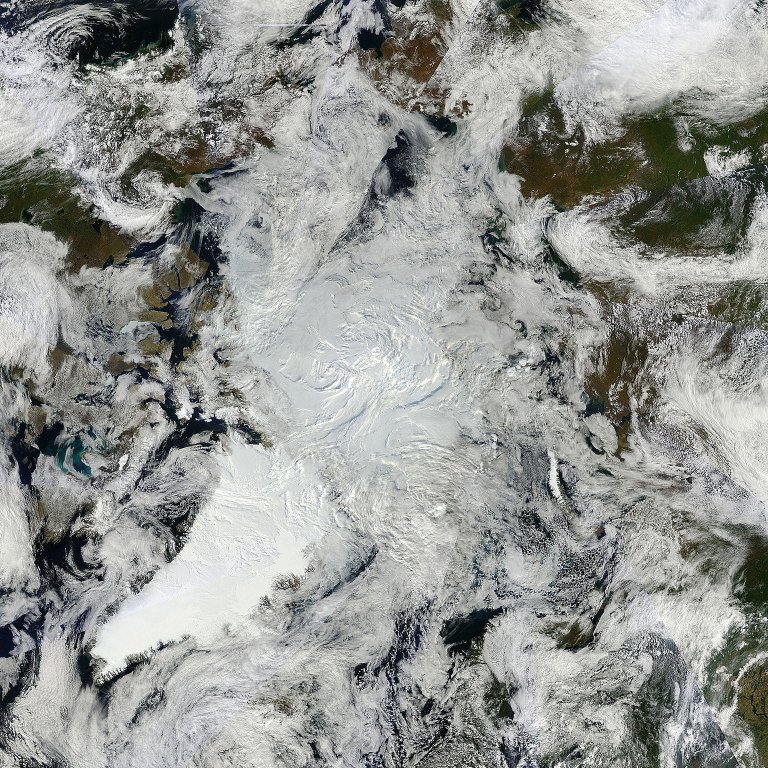
MODIS Arctic mosaic Sept 01 2011 - resized to 8km scale.
The latest complete Arctic mosaic shows an amount of consolidated ice very similar to that for this time in 2007. Bearing in mind that we have over 2 weeks of melting still to go and that the 2007 ice was on average older and thicker, it would be entirely unsurprising to see 2011 set a new record low for ice extent.
Image sources:
http://www.ijis.iarc.uaf.edu/seaice/extent/
http://nsidc.org/arcticseaicenews/
http://lance.nasa.gov/imagery/rapid-response/


Comments