


Legend has it that Isaac Newton’s groundbreaking work on the laws of motion was inspired by an apple falling on his head.[1] The story sounds apocryphal, but the great man’s contemporary biographer dutifully recorded questions sparked by his friend’s encounter with nature. "Why should that apple always descend perpendicularly to the ground?" Newton asked. “Why should it not go sideways, or upwards? But constantly to the Earth’s center?” The answers to these questions proved powerful enough to calculate to a useful degree of accuracy the movement of everything from a small apple[2] to the planets themselves.
There is value, then, in taking a bit of time to appreciate nature. In fact, it can even be a great way to boost one’s net worth, as the natural world is as much an inspiration in finance as it is in scientific pursuits.
The ecology of banking
That concept was put to the test not so long ago by a pair of Englishmen inspired by the natural world. The Lord May of Oxford, an ecologist and former Royal Society president, teamed up with Andy Haldane, the Bank of England’s chief economist, to see if they could come up with a complex financial model after observing the world around them.[3]
Though written a decade ago, the paper has extra relevance today, as the authors wondered whether an understanding of the effects of a “super spreader” contagion in nature could assist in developing public policies that would guard against systemic flaws that spread financial contagion.
The idea wasn’t to derive a fully baked financial strategy simply by standing outside and receiving a bit of inspiration. Rather, the point is to see whether an analysis of natural effects offers a perspective that’s useful in a finance, a profession where discoveries are typically made by individuals staring at spreadsheets on computer monitors.
The investigation took place in the wake of the 2007-2008 banking system meltdown, and so it reflects their recent experience with that disaster. They found existing theories failed to adequately explain the propagation of shocks and instability within a financial system. With the interaction of the choices of millions of participants around the world, each operating with their own sets of motivations, the financial world is a phenomenally complex adaptive system — just like the natural world, which consists of millions species interacting with one another.The actions of a single investor or a single financial institution create a ripple effects that can help or hurt multiple investors and institutions. No investment takes place in a vacuum. In epidemiology, the same is true. Someone infected with a disease like Covid-19 can infect friends, family and random strangers simply by interacting with them. Most epidemics can be traced back to a “patient zero” who spread the contagion to susceptible individuals creating a ripple effect throughout society.
Financial shocks propagate through the banking system in a way that’s similar to how a virus spreads. The banking system relies on a complex series of interactions between financial institutions. For it to work, banks must make short-term loans to one another so that everyone always has the capital reserve needed to operate.
In this highly simplified example, a single failing bank can, in extreme circumstances, drag down multiple institutions with which it does business. Imagine you ask for your money back after putting $1,000 in a hypothetical bank in which you’re the only customer. Your money isn’t put in the vault for safekeeping. Instead, about $100 is put in reserve so the bank can use the rest of your funds, $900, to make loans or other investments. When you come in to reclaim your $1,000, your bank will simply borrow $900 from another bank, Bank B, through a short-term loan.
Banks flush with cash are happy to oblige since they collect interest for a loan that usually is paid back within 24 hours, or a week at most. The Federal Reserve uses its power to set the reward for making such loans as its primary tool for balancing risk levels and employment levels and economic growth. The so-called federal funds rate has varied from 19 percent in 1981 to the meager 0.09 percent currently on offer.[4]
But what happens when a bank runs out of money after making a series of bad loans and investments? Once the capital reserves fall below the minimum set by the Fed, that institution is in trouble — particularly under the rules in effect in 2007. It can’t pay back its creditors, especially Bank B. Now Bank B is down $900, and if its assets and overnight borrowing ability are stressed, it too will fail, further dragging down Bank B’s creditors — and so on throughout the banking system.
The system is more complex than this in practice, but the above is meant to provide a basic sketch of how market liquidity shocks propagated in the 2007-2008 financial meltdown. Consumers who had taken advantage of absurdly generous “no money down” sorts of mortgage offerings began to default in droves. The mounting losses crippled banks’ capacity for making interbank loans. With their reserves run dry, banks had no money to lend to businesses and consumers. The resulting credit crunch meant businesses couldn’t grow, and the economy stalled not just in the United States, but worldwide.Does nature have any advice to offer to keep history from repeating itself, with a series of failures dragging the entire world down? Traditionally, regulators have boosted liquidity and capital requirements to reduce the risk of individual bank failure. May and Haldane were inspired by ecology to address the problem holistically and came up with the idea of making the banking network, rather than just its component parts, more resilient — a technique used in epidemiology.
The way epidemiologists stop the outbreak of a virus spread by interpersonal contact is to focus on the “super spreaders.” That is, efforts go to reining in the 20 percent of individuals who are responsible for 80 percent of the spread of the disease. Typically, such outbreaks follow a pattern in which a minority of Typhoid Marys end up having a disproportionate ability to infect others because they have more connections with susceptible individuals. [5]
Too-big-to-fail institutions are so large that they are the super-spreaders of the financial world. They are much more connected to the smaller, weaker financial institutions that regularly borrow from them to keep their reserves topped up.
May and Haldane’s proposal was to adjust each bank’s capital requirements “to equalize the marginal cost to the system as a whole of their failure.” That would mean, instead of setting one-size-fits-all reserve requirements for each bank, the rules would vary according to risk level. Bigger banks or banks that had more connection to other banks would have to keep greater reserves on hand.
The capital requirements would also be adjusted to rise in boom cycles and lower during recessions to make the system more resilient to the ups and downs of the business cycle. The net result would be a system better able to absorb shocks without collapsing. Small institutions that don’t lend much to others would be allowed to take more risks because the consequence of their failure is minimal. Big banks, on the other hand, would have to take a more conservative course because their capacity to do damage is so much higher.
Not surprisingly, Congress and international regulators have been pushing risk-based requirements for quite some time. The Federal Deposit Insurance Corporation (FDIC) implemented strengthened risk-based capital requirements in 2012,[6] and the leaders of the ten largest central banks came up with proposals known as Basel I and Basel II before that. But, as May and Haldane noted, those efforts focused on individual institution risk rather than the systemic risk suggested by epidemiology.
Mathematics is the middle term between nature and finance
It’s no accident that lessons from nature can be applied to finance, as mathematics describes the complex patterns of nature and finance alike. Natural phenomena, from the smallest DNA molecule[7] to the largest spiral galaxy, from flower petals to Nautilus shells, reflect a regular pattern. One pattern that seems to appear just about everywhere was called “mean and extreme ratio”[8] by the ancients. They used it as a guide in building the wonders of the ancient world like the Great Pyramid of Giza. Medieval mathematician Leonardo Bonacci, whom we can thank for advancing the demise of Roman numerals in western commerce and mathematics,[3] expressed the pattern as a sequence of numbers — 1, 1, 2, 3, 5, 8, 13, 21, 34, 55, 89, 144 and so on. Each of these numbers is the sum of the preceding two numbers.
Called the Fibonacci sequence in Bonacci’s honor, the numbers approach what we now call the golden ratio, or 1.1618. To the extent that art follows nature, you’ll also find the ratio in music,[9] painting, sculpture and architecture. Da Vinci himself provided illustrations for a book about the “divine proportion,”[10] and artists from the Renaissance to the present day have created works that reflect the harmony that this ratio describes in nature.
Fibonacci’s appearance in finance
In finance, a field that doesn’t much care about aesthetics, you’ll find some traders who use the Fibonacci numbers to make money. In 1935, Harold M. Gartley published “Profits in the Stock Market,”[11] and on page 222 he included a set of figures describing patterns of an upward market trend and a downward market trend. These patterns are used to this day by traders who believe it can identify the point in which a stock price is about to reverse — knowing that before it happens is key to turning a profit. The idea is that when one observes the pattern on a market activity chart, it can serve as a warning that the price is about to plunge and it’s time to sell, or, conversely, it’s time to buy because the trend will continue sharply upward in the case of the bullish chart.
Roughly speaking, the “bullish” Gartley pattern resembles the letter M, while the bearish pattern is the same figure upside-down, looking like a W. Later analysts realized that “Gartley 222” chart described a harmonic pattern of Fibonacci ratios. The chart starts at point X, which will either be high (in a bear pattern) or low (in a bull pattern). The four movements that follow are described by the letters A, B, C and D. It’s a bullish Gartley 222 when the chart meet the following dimensions. After an upward movement from X to A, a downward correction followsfrom A to B. If AB is 61.8 percent of XA, and is followed by a 38.2 percent rise from B to C, and then there’s a drop from C to D whose value is 1.618 times larger than from B to C — then the chart is in play. The idea is that it’s time to buy because the value is about to rebound.
This theory is popular enough that automated Fibonacci sequence detection capabilities are built into trading platforms.[13] But does it actually work? Economics professor Kuldeep Kumar and business and AI researcher Sukanto Bhattacharya sought to find the answer.[14] They applied computer analysis of a time-series plot of the S&P closing values between 1998 and 2003. They noted the largest “retracements,” or short-term changes in value, during the study period.
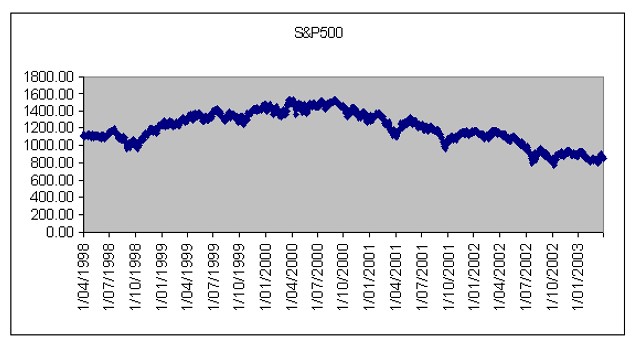
Right off the bat, the percentage value of the changes approached the Fibonacci levels of 23.6 percent and 38.2 percent. The analysis found the positive correlation between the variables was significant. While far from conclusive, the analysis suggests there might be something to this technique.
Kumar and Bhattacharya appeared a bit surprised by their own findings. “We are inclined to opine,” they concluded, “that all of technical analysis is definitely not a voodoo science and there are in fact elements of true science lurking in some of its apparently wishful formulations, just waiting to be uncovered by the enterprising investigator.”
Scientists are rightly skeptical of any phenomenon that defies rational explanation. But the market is moved by the individual choices of its participants and the automated trading scripts they author. It very well could be that the decisions to buy and sell “feel right” at the time tothe traders seeking to balance their portfolio. Each move is made at points that feel “natural” in the same way that an artist might frame his subjects in a golden ratio without necessarily knowing the underlying mathematics. Is it really that surprising that players in the market seek the same harmony that surrounds them in nature? The more one explores the world of biology, the more one realizes it can teach us a thing or two about finance.
Joseph Byrum is chief data scientist at Principal. He holds a Ph.D. in quantitative genetics and his current work is focused on developing artificial intelligence tools to provide a measurable increase in investment accuracy.
[1]
William Stukeley, Memoirs of Sir Isaac Newton's Life (1752). MS/142, Royal
Society Library, London http://www.newtonproject.ox.ac.uk/view/texts/normalized/OTHE00001
[2]
Creative Commons photo of Newton’s apple tree, source: https://commons.wikimedia.org/wiki/File:Apple_tree_Woolsthorpe_Manor.JPG
[3]
Haldane, A., May, R. Systemic risk in banking ecosystems. Nature 469, 351–355
(2011). https://doi.org/10.1038/nature09659
[5] Stein, Richard A. “Super-spreaders in infectious diseases.” International journal of infectious diseases : IJID : official publication of the International Society for Infectious Diseases vol. 15,8 (2011): e510-3. doi:10.1016/j.ijid.2010.06.020 https://www.ncbi.nlm.nih.gov/pmc/articles/PMC7110524/
[6]
https://www.fdic.gov/news/financial-institution-letters/2012/fil12026.html
[7] Yamagishi, M.E.B., Shimabukuro, A.I. Nucleotide Frequencies in Human Genome and Fibonacci Numbers. Bull. Math. Biol. 70, 643–653 (2008). https://doi.org/10.1007/s11538-007-9261-6
[10] May, Mike. "Did Mozart use the golden section?" American Scientist 84, no. 2 (1996): 118+
[14] Sukanto Bhattacharya and Kuldeep Kumar. (2006) “A computational exploration of the efficacy of Fibonacci Sequences in Technical analysis and trading” http://epublications.bond.edu.au/business_pubs/32


Comments