

Take a number. Take a second number. Add both together to produce a third. Again, add the last two numbers to produce the next. Repeat ad infinitum.
What can be more boring?
Well, the simple sequence you just generated has been studied for more than eight centuries, and continues to fascinate mathematicians, artists and numerologists alike. Countless research publications deal with Fibonacci sequences and related matters, there is a magazine dedicated to Fibonacci sequences, and every two years you can attend an International Conference on Fibonacci Numbers and Their Applications.
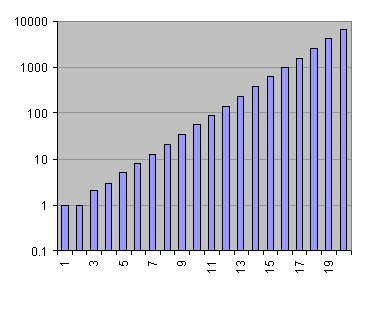
In a recent blog I introduced the term 'Fibonacci Chaos'. This might seem a misnomer. Aren't Fibonacci sequences very well behaved? Apart from the first few terms, each next number is about 1.618 times the previous. So when you plot the Fibonacci numbers on a logarithmic scale perfect regular behavior results (see figure).
'Fibonacci Chaos', much ado about nothing then?
Well, let me try to convince you that a very rich chaotic dynamics is hidden in these 'boring' Fibonacci sequences. Moreover, the simple discrete structure of Fibonacci sequences provides us with a perfect playground to build insight into the emergence of chaos in reversible dynamic systems.
Golden Butterflies
The hallmark of chaos is the phenomenon called 'sensitive dependence on initial conditions'. This is about the proverbial butterfly in Rio flapping its tiny wings and thereby causing a chain of events amplifying into a hurricane hitting Texas coast a few weeks later. In more mathematical terms the butterfly effect is characterized by an exponential dependence on initial conditions: a slight perturbation in the initial condition gets multiplied each timestep until the whole evolution is unrecognisable from the unperturbed evolution.
So where is the butterfly in the Fibonacci sequence?
First, we need to view the Fibonacci sequence as a dynamics. Think of each next number in the sequence as a next step in a Fibonacci time evolution. The question now is whether or not small perturbations in the initial conditions (I.e. in the first two terms of the sequence) multiply exponentially into the Fibonacci evolution. To check for such butterfly effect, rather than starting with the standard initial values 0 and 1:
0, 1, 1, 2, 3, 5, 8, 13, 21, 34, ...
we start with arbitrary numbers 'a' and 'b'. Let's see what we get:
a, b, a+b, a+2b, 2a+3b, 3a+5b, 5a+8b, ...
Do you recognise the original Fibonacci numbers appearing again?
Now let's create a perturbed sequence by keeping the first number (a) unchanged, whilst slightly modifying the second number into b+d. If we do this and then list the differences of the corresponding terms in both sequences, a Fibonacci sequence appears that describes the evolution of the perturbation:
0, d, d, 2d, 3d, 5d, 8d, ...
As we saw in the first figure, Fibonacci sequence grows exponentially. And so does this perturbation evolution sequence. Hence here we have our Fibonacci butterfly. Each step in the Fibonacci evolution of the perturbation represents a [golden magnification]. Whilst each seperate golden multiplication in itself is rather modest, they quickly add up. It takes only 45 golden steps to billionfold magnify a butterfly wing flap.
But there is more to this Fibonacci chaos. To reveal some of the subtleties of the chaotic behaviour hidden in Fibonacci sequences, we need to decompose the numbers in this sequence into their most elementary building blocks, and study the effect of the Fibonacci dynamics on individual bits.
Bit Turbulence
The Fibonacci sequence when represented in binary format reads:
0, 1, 1, 10, 11, 101, 1000, 1101, 10101, 100010, ...
We can place these bit strings on a grid, each subsequent number on a next row, with the bits ordered from right to left in order of increasing significance, and such that the bits in each vertical column have equal significance. When we color code the bits (white for '0' and blue for '1') a remarkably chaotic figures result: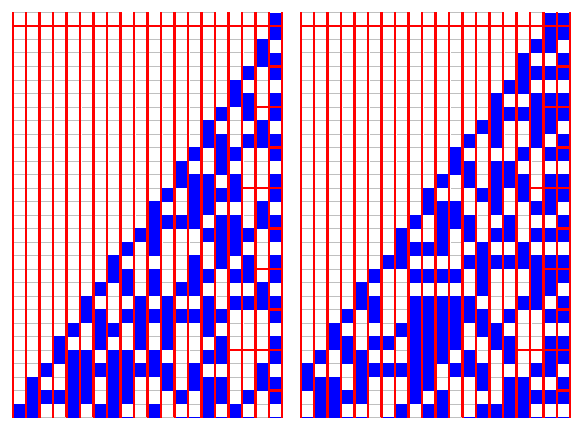
It might seem surprising that such a simple rule (add the last two numbers to get the next) results in such a rich behavior. Notice that I have shown two binary evolutions for slightly different starting conditions (1, 1 and 3, 3, respectively). Both evolutions behave qualitatively the same: both grow with the same slope (the base-2 logarithm of the golden ratio), within the triangle of growth both have a 50:50 distribution of white and blue cells, and both evolutions appear visually similar and equally random. Yet, with the exception of the rightmost columns (we shall shortly see why) a bit-by-bit comparison of corresponding cells reveals that both patterns are completely uncorrelated. Again a manifestation of the 'golden butterfly'.
One may generate many of such evolutions, each with different starting conditions. When averaged over a long enough evolution, each pattern will be statistically independent of the others. Yet hidden in these apparently random patterns is a remarkable regularity. A period-doubling structure that comes into effect when bits get added into the evolution. I have stressed this structure by drawing red rectangles in both Fibonacci evolutions. The rightmost column has boxes covering three timesteps. The next column to the left has boxes of length 6, the next column 12, and so on. (Notice that box lengths 48 and beyond run out of the short evolution displayed in the figure.)
If you look carefully, you should notice that in both evolutions the columns of boxes show a perfect repeat pattern. In other words: each individual evolution has one unique box of each size, and for each pattern the boxes at certain bit position are all identical. Needless to say that between the two figures, corresponding boxes will differ dramatically.
If you opt to follow the Fibonacci dynamics of just the first n bits [modular arithmetic], the observed period doubling causes a [Poincare recurrence] every 3.2^(n-1) steps. If you increase the bitstring length to n+1 bits, the recurrence occurs in 3.2^n steps. Each bit added increases the recurrence by a factor of two.
What mechanism causes this period doubling?
Let's reduce the Fibonacci dynamics to its most basic form. We set n=1 and track just one single bit. It should be clear that for single bit operation the Fibonacci dynamics reduces to a '[exclusive or]' (XOR) operation: each next bit in the evolution is the XOR of the last two bits. The unique nonzero Fibonacci bit sequence that follows is
0, 1, 1, 0, 1, 1, ...
The same would hold for higher significance bits added, were it not that higher significance bits are affected by the carry of bits generated from the operations on the less significant bits. This transport of bits from less significant levels to bits at levels of higher significance is akin to the effect smaller eddies have on larger ones in turbulent flows. It is this 'bit turbulence' that causes the period doubling.
Phase Space Dynamics
Rather than displaying the Fibonacci sequence as it unfolds in time, the Fibonacci evolution can be visualized in more compact form by displaying the evolution dynamics. This boils down to plotting the evolution in what physicists refer to as 'phase space'.
Each point in the phase space of a dynamical system represents the information that is needed to determine its full evolution. For our Fibanacci system, the evolution is determined by specifying two subsequent numbers in the Fibonacci evolution. So Fibonaci phase space consists not of Fibonacci numbers, but of pairs of subsequent Fibonacci numbers. In other words, the phase space is a two-dimensional coordinate grid.
On this grid, Fibonacci evolutions are represented as a trail of positions, one position for each timestep in the evolution, and each position in the trail having coordinates corresponding to consecutive elements in the Fibonacci sequence. We will distinguish the different evolutions using symbols of different colors to indicate the trail of position.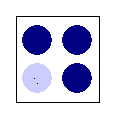
For a single-bit Fibonacci sequence, the phase-space is a 2x2 grid. A three-point trail and a single-point trail can be distinghuished on this grid (indicated in the figure as circular symbols of different colors). These correspond to the zero sequence (0, 0, 0, 0, ...) and the sequence previously represented by the box of length three (1, 0, 1, 1, 0, 1, 1, 0, 1, ...)
Now what happens if we do not limit ourselves to one bit, but to one digit? The phase space grows to a 10x10 grid, on which an interesting pattern consisting of multiple evolutions develops: 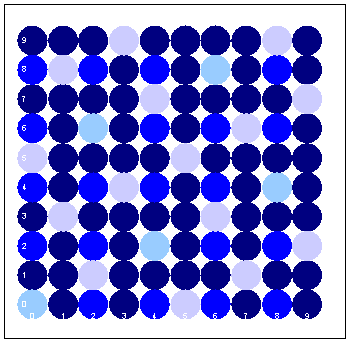
What about the generation of phase space plots in even higher bases? These are easy to achieve once you realize that single position base-r Fibonacci is equivalent to mod r Fibonacci arithmetic.
Experimenting with Fibonacci phase space plots gives a lot of insight into the nature of chaos in time-reversible systems. Starting with a compact cloud of points, you will observe that in the next timestep this cloud has stretched (by a factor equal to the golden mean) in one direction, and compacted (by a factor equal to the inverse of the golden ratio) in the other.
Mathematicians refer to this phase space stretching and compaction as 'Anosov diffeomorphism'.
It is at the very heart of all chaos behaviors observed in nature.


Comments