


Most spiral galaxies, including our Milky Way, have a large concentration of ancient stars surrounding the center that astronomers call 'the bulge'. Understanding the formation and evolution of the Milky Way's bulge is vital for understanding the galaxy is a whole. However, obtaining detailed observations of this region is not an easy task.
The large mirror, wide field of view and very sensitive infrared detectors of ESO’s 4.1-meter Visible and Infrared Survey Telescope for Astronomy (VISTA) make it by far the best tool for this job. The team of astronomers is using data from the VISTA Variables in the Via Lactea programme (VVV), one of six public surveys carried out with VISTA. The data have been used to create a monumental 108 200 by 81 500 pixel colour image containing nearly nine billion pixels. This is one of the biggest astronomical images ever produced. The team has now used these data to compile the largest catalog of the central concentration of stars in the Milky Way ever created.
The image used in this work covers about 315 square degrees of the sky (a bit less than 1% of the entire sky) and observations were carried out using three different infrared filters. The catalog lists the positions of the stars along with their measured brightnesses through the different filters. It contains about 173 million objects, of which about 84 million have been confirmed as stars. The other objects were either too faint or blended with their neighbors or affected by other artifacts, so that accurate measurements were not possible. Others were extended objects such as distant galaxies.
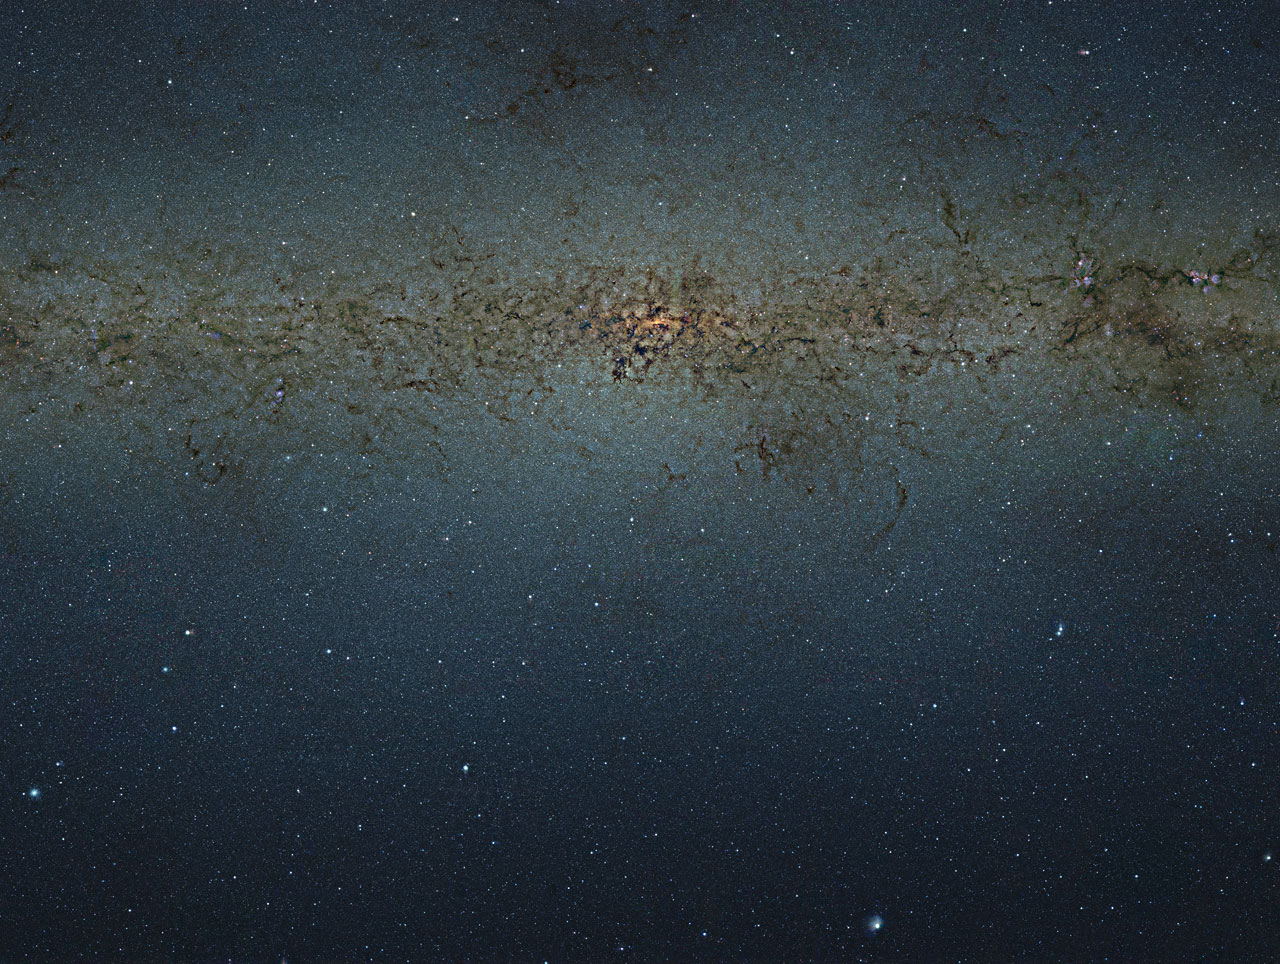
Mosaic of the central parts of the Milky Way showing 84 million stars, though good luck seeing them in this image. Click on the image instead and get it in giant size. Credit: ESO/VVV Consortium
Acknowledgement: Ignacio Toledo, Martin Kornmesser
"Observations of the bulge of the Milky Way are very hard because it is obscured by dust," says Dante Minniti (Pontificia Universidad Catolica de Chile, Chile), co-author of the paper. "To peer into the heart of the galaxy, we need to observe in infrared light, which is less affected by the dust."
To help analyze this huge catalog the brightness of each star is plotted against its color for about 84 million stars to create a color–magnitude diagram. This plot contains more than ten times more stars than any previous study and it is the first time that this has been done for the entire bulge. Color–magnitude diagrams are very valuable tools that are often used by astronomers to study the different physical properties of stars such as their temperatures, masses and ages. A color–magnitude diagram is a graph that plots the apparent brightnesses of a set of objects against their colors. The color is measured by comparing how bright objects look through different filters. It is similar to a Hertzsprung-Russell (HR) diagram but the latter plots luminosity (or absolute magnitude) rather than just apparent brightness and a knowledge of the distances of the stars plotted is also needed.
“Each star occupies a particular spot in this diagram at any moment during its lifetime. Where it falls depends on how bright it is and how hot it is. Since the new data gives us a snapshot of all the stars in one go, we can now make a census of all the stars in this part of the Milky Way,” explains Minniti.
Loading player...
Panoramic video gives a closer look at a huge new image of the central parts of the Milky Way made by combining thousands of images from ESO’s VISTA telescope on Paranal in Chile and compares it with the view in visible light. These infrared data, which come from the VVV public survey, have been used to study a much larger number of individual stars in the central parts of the Milky Way than ever before. Because VISTA has a camera sensitive to infrared light it can see through much of the dust blocking the view in visible light, although many more opaque dust filaments still show up well in this picture. Credit: ESO/VVV Consortium/Nick Risinger (skysurvey.org) Music: Delmo -- Acoustic (disasterpeace.com) Acknowledgement: Ignacio Toledo, Martin Kornmesser
One interesting result revealed in the new data is the large number of faint red dwarf stars. These are prime candidates around which to search for small exoplanets using the transit method, which finds planets searches for the small drop in brightness of a star that occurs when a planet passes in front of it and blocks some of its light. The small size of the red dwarf stars, typically with spectral types K and M, gives a greater relative drop in brightness when low-mass planets pass in front of them, making it easier to search for planets around them.
Paper: R. K. Saito, D. Minniti, B. Dias, M. Hempel, M. Rejkuba, J. Alonso-García, B. Barbuy, M. Catelan, J. P. Emerson, O. A. Gonzalez, P. W. Lucas and M. Zoccali, 'Milky Way demographics with the VVV survey', A&A Volume 544, August 2012 http://dx.doi.org/10.1051/0004-6361/201219448 (FREE TO READ)


Comments