

The figure, pasted below for your convenience, is from the CDF collaboration, and it refers to a "famous" analysis - one of the few important measurements for which Run II at the Tevatron was considered a good idea (thank god that one sold with the funding agencies, because there were sooo many others that eventually paid off!).
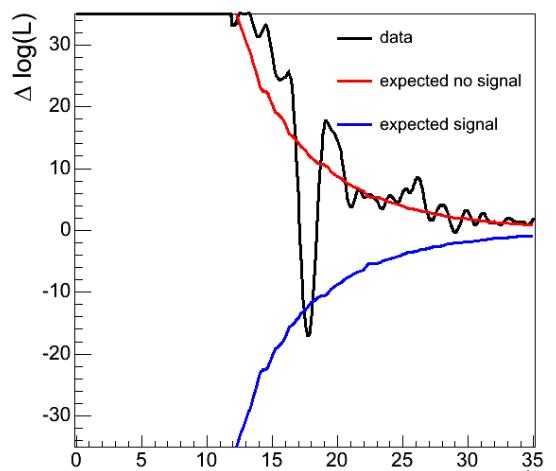
Now, despite being public, the particular figure has received relatively little attention, since another way of displaying the data is preferred to it. The analysis is the one that observed the oscillation of B_s mesons into their antiparticles, measuring the frequency of the oscillations -the parameter shown on the horizontal axis. As was explained in the comments thread of the original post, the vertical axis shows the log likelihood ratio of two different hypotheses, one which involves no oscillation signal, and the other considering the hypothesis that B_s mesons do oscillate, with a frequency corresponding to the value of the x axis considered. The ratio is thus a function of the unknown hypothetical frequency, but it is expected to follow the "null hypothesis" curve on top if B_s mesons do not oscillate. Note that the two hypotheses get closer as x increases, due to the fact that for too high oscillation frequency the signal cannot be distinguished anymore (a feature which depends on the finite resolution of the detector). The log-likelihood ratio is a common measure of the statistical "difference" between two hypotheses, so it is expected to decrease for less distinguishable cases.
I do not mean to spend my and your time today delving in the complex (albeit beautiful) physics of flavour oscillations. I think it is enough to explain the basic idea in as few words as possible. B_s mesons are bound states of a anti-bottom and a strange quark. They are neutral (both bottom and strange quarks have -1/3 charge, so their quark-antiquark combinations have charge zero), and have the surprising property that they can, almost magically, turn into their own antiparticle, by means of a complex mechanism.
It so happens that the bottom and the anti-strange quarks making up a anti-B_s have a certain probability of exchanging a W boson while they are still bound in the meson. In so doing, the bottom quark may temporarily become a top quark (this is the most likely thing that a bottom can turn to as it absorbs a W boson, if energy conservation can be waived for a tiny time instant), and the anti-strange quark will temporarily become a anti-charm quark (also the most common possibility, given the value of V_cs, the matrix element of the Cabibbo-Kobayashi-Maskawa mixing matrix).
 The W exchange takes an impossibly short time to take place, but the latter quarks lives even shorter, as they immediately exchanging another W boson, whereby the top becomes a strange quark, and the anti-charm becomes an anti-bottom one. The end result is that the anti-B_s has become a B_s! The graph on the left in the figure above will clarify what I mean. In the graph time flows from left to right, and continuous lines show the propagation of quarks, while wiggly green ones the propagation of W bosons. Note that the diagrams describe both the oscillation of B_d and B_s mesons -they are the same process, although their oscillation frequency is very different due to the different value of the involved parameters.
CDF in 2006 measured the oscillation frequency with great precision. These measurements are important because they open the possibility to measure some parameters governing the physics of B mesons, ones connected to the violation of a symmetry of Nature called "CP". We believe that CP violation is one of the key to understanding the origin of the Universe as we know it... But the topic is too broad for this post!
I must also say that the plot I posted this time was too difficult to guess- I wanted to find something easier but then got caught by the one I ended up posting. Ok, never mind, next time I will put up something for non specialists. Thanks to all who tried an answer and also to those who spent a minute on the question.


Comments