


The most prestigious journal in the field of microscopy published an article by us this year and the work also already spawned a book chapter. Apart from the work not being critical of anything and having many cute pictures, the reason for it making it into a respectable journal may be partially due to it actually being interesting:
It is a computer program, but my brain’s visual center does the main work! Now you could think that such must be very inaccurate. However, I managed to prove the accuracy of the method quantitatively, so now we have a precise analysis method that uses the computer for the exact part and the human hunter/gatherer’s superb visual cortex for the hard part.
What is it about? Many imaging techniques like microscopy for example only allow you to see the flat projection of what is actually three dimensional. It can be impossible to derive crucial information about relative locations. The following picture shows spherical clouds of particles inside boxes and their flat projections on the walls as they would also appear in some microscopes:
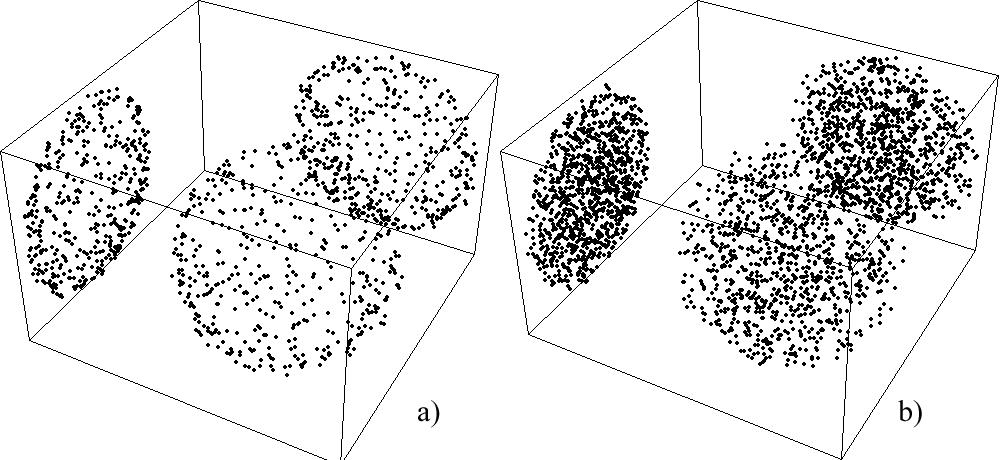
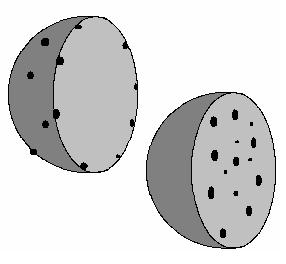
What is the difference? The first one, a), has only particles on top of the surface of the sphere. The second one, b), has particles also inside of the sphere. Like so:
However, given only the flat projections, how would you be able to know where the particles are?
Sure, you see that the projections of the first one seem to have more particles on the outside; the one with particles in the inside seems as if there are very many particles right at the center. But are there actually many more in the very center or is the distribution homogeneous?
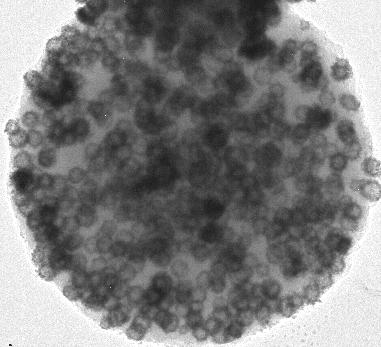
There are many expensive and time consuming ways to solve such problems, like so called SEM tomography. You could get a first hint by taking two pictures at a different angle, if your imaging setup allows such, then trying to look at it stereoscopically. Here I have done it for you with a composite nanoparticle from our laboratory. Zoom until the centers are your eyes' distance apart and look into infinity (or employ crossed eye viewing, but do not blame me for the headache):
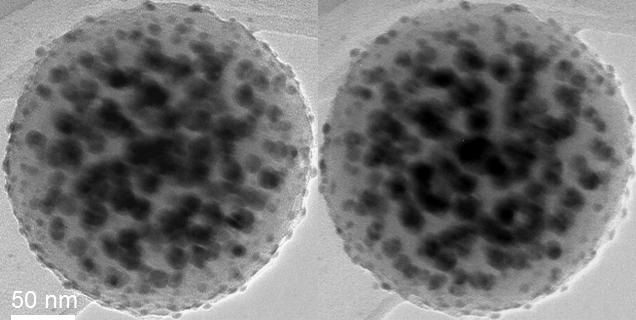
Every single picture looks like there is a lot of black stuff in the middle, but in stereo mode it is quite obvious that the center is completely free of particles. Meaning, the sample may not do what it was designed for.
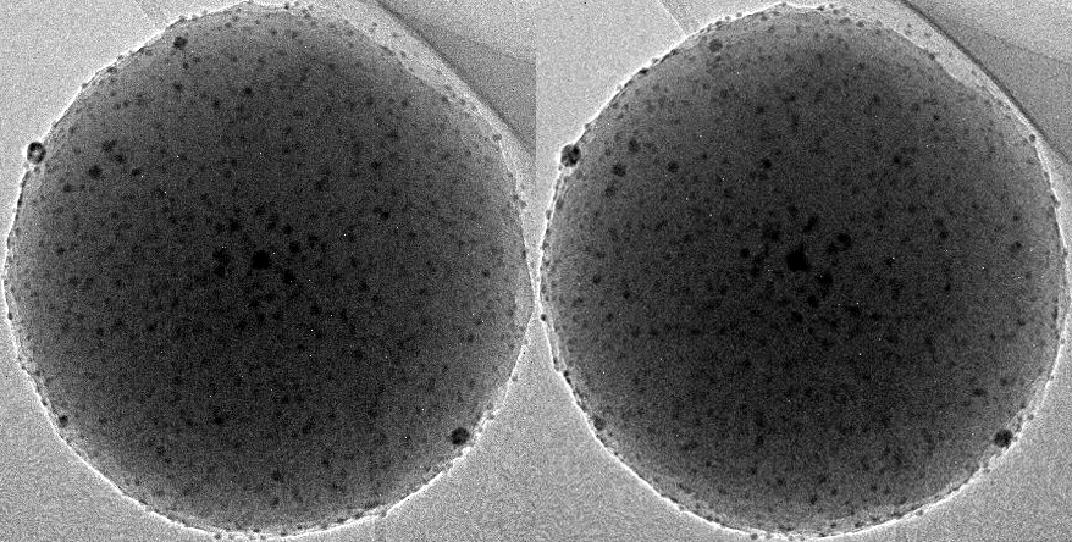
Stereoscopic viewing in this way will never tell you reliable values like the density of particles as it depends on the distance from the surface for example. I mean, just try to start figuring out single particles in this one for a real bad headache:
So what to do? The novel method is called “Quantitative Analysis of Images by Visual Walk-in of Simulations”.
The idea is simple: You give the computer whatever you know about the structure, and whatever you do not know, you leave variable. Then you let the computer simulate the image as it would look like with some initial guess for the unknown parameters. And now comes the part that the computer cannot do and where your brain comes in: The computer gives it back to you via the display. You look at the simulation and ‘walk in’ the unknown parameters until the simulation fits the actual image. After that, the computer takes over again and calculates desired data.You may well expect that this is either not novel or, in case of three or four unknown parameters, never works, but the novelty lies in making it exact and realizing that it does work very well. The expectation of this not ever going to work underestimates the human visual system and its neural networks. We are gatherers and hunters at the same time, hence, although many of our abilities often compare poorly with those of specialized animals, our visual system is top notch, one of the very best out there.
With a little exercise, you will see the slightest differences standing right out. This method is now applied to quite complex structures, like these spheres with hollow metal spheres inside:
These are transmission electron microscope images, thus you can see through the metal shells into the inner, hollow cores.
There are several I believe really nice points to be stressed about this method:
1) The concept is quite general and can be adapted to many situations (say dendrites randomly stuck to flat microscopy stages, fast geological surveys, …)
2) Varying the free parameters between ‘too much’ and ‘too little’ tells you the variability of the visual comparison step. This uncertainty is often much less than the sample variation, for instance when given the many nanoparticles from any particular batch. In that case, the method is therefore precise in the correct scientific meaning of the term.
3) The computer can automatically calculate all kinds of parameters that would be extremely difficult to come by with other methods, and this step is exact, because it involves no further uncertainty (the computer knows exactly where every atom is in the model). Look for example at the following dielectric-bimetallic composite (a). It is a sub-micron carbon sphere with gold nanoparticles on the outside surface and silver nanoparticles in the interior. Obviously, the distribution of the metallic nanoparticles is crucial for the compound’s optical properties; the surface location is important for catalytic properties, and so on.
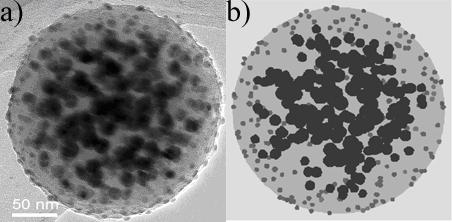
Quantitative Analysis by Visual Walk-in of Simulations -- one of the simulated images is (b) -- determines all these properties and their error ranges:
- Surface covering percentage of the gold nanoparticles
- Number density n of the silver particles and that n is homogeneous inside an inner shell
- The outside diameter S and inside diameter s of that shell
- The factor f by which the size of the inner nanoparticles increases towards the interior (A simulation with a higher number density instead of bigger nanoparticles in the center does not look similar at all.)
- Total mass of gold and total mass of silver in one sphere (Not easy to get otherwise, because the density of the carbon sphere is unknown and the sample can have 1010 to 1014such spheres – this method has allowed us to prove that these carbon spheres have a density of only half that of water, which is much lower than the lightest known amorphous carbon material).
Here is a simulation of a reaction that replaces silver (Ag) by palladium (Pd) and thus leaves hollow outside-Pd-inside-Ag nanoparticles in the sub-micron sphere; for fun the palladium is in red:
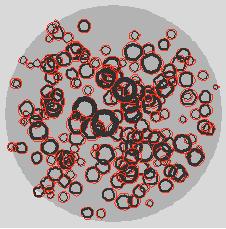
Note that only a quarter (25%) of the silver was replaced but it looks like as if already much more is missing. Playing around with this helps quite a bit in interpreting the images from the imaging setup even if one is not out to establish any quantitative results.
--------------------------------
And here in shameless self promotion the references where it is explained in all detail and pedagogically, also including example computer code (Mathematica):
S. Vongehr, S.C. Tang, X.K. Meng: Quantitative Analysis of Particle Distributions by Comparison with Simulations. Microscopy and Microanalysis 17(1), 61-66 (2011) journals.cambridge.org
S. Vongehr, S.C. Tang, X.K. Meng: Microscopy Analysis by visual Comparison with simulated Images. in A. Mendez-Vilas and J. Diaz (Eds.): Microscopy: Science, Technology,Applications and Education Formatex Microscopy Book Series 4(2), 1565-1571 (2010) www.formatex.org/microscopy4/index.html


Comments