


19 April 2010, version 2.0
While Haiti is still sorting out the chaos from its January earthquake, the Earth suffers another massive quake in Chile. At a magnitude of 8.8 on the Richter scale this is one of the most powerful earthquakes ever recorded. Concerns about a tsunami spreading across the Pacific have abated and the Chilean authorities claim they have the resources to handle the catastrophe.
Why are we having so many earthquakes recently? Is it just that the media likes to report dramatic and tragic events, or has there been a quantitative increase? The graph below appears to tell a worrying story.
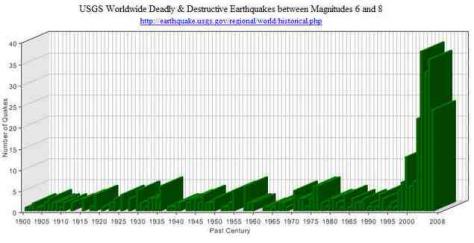
The graph legend states "USGS Worldwide Deadly&Destructive Earthquakes between Magnitudes 6 and 8" and plots data from 1900 to 2008. It appears to show a huge spike in major earthquakes starting some time around 1999. The conspiracy theorists have been all over this like a rash and numerous fingers are pointing to HAARP technology. Even the official literature states that starting in 1996 HAARP tested its capabilities for geological mapping using ELF waves by modulating the ambient current in the ionosphere using HF radio waves. Such a graph, showing a spike soon after HAARP started, seems to confirm the theorists' worse fears that not only has there been an increase in destructive earthquakes but that they may well be artificially created.
However, there's one problem with this theory: the graph does not show what it claims to show.
If you go to the URL referenced in the graph's title - http://earthquake.usgs.gov/earthquakes/world/historical.php - you will find the data upon which the graph is based. However, the subheading on that webpage reads:"Selected earthquakes of general historic interest." This is not a full data set but one selected by the USGS as being of historic interest. The above graph is therefore an artefact of this selection process. To claim that there has been a huge increase in major earthquakes based solely upon this graph is therefore false.
Luckily, another page at the USGS does have a full data set, although sadly only going back 30 years. I therefore created my own graph by calculating all the earthquakes above magnitude 6 for each year. The new graph looks like this:

Along the vertical axis are the number of such earthquakes per year and along the horizontal axis are the years 1980 to 2009. The line plotted is a rolling 10-year average to see if there is any trend. Admittedly, this is not 100 years worth of data but the concerns about the first graph were about a recent increase in major earthquakes so comparing the two is worthwhile.
As we can see, there was an upward trend in the 1990s but this has since stabilised at about 150 major earthquakes globally per year - or an average of 3 per week. Those earthquakes that make headline news are obviously those that cause chaos and destruction to humans. But there are many earthquakes around the world every single day, they just don't get elevated from local or national news onto the world stage.
If every earthquake was a harbinger of an impending apocalypse then I think I would go look for a different omen or live in perpetual disappointment. As for conspiracies, not all of them are wrong, but in this particular case, ditch that graph!
So, has there been a spike up in major earthquakes over the last decade? No.
Has there been any increase in major earthquakes in recent history? Some during the 1990s, although the data I have only covers the last 30 years. The USGS, who hold all the data, say that major earthquakes have been fairly constant.
Has something fundamentally changed in the motions of the Earth's tectonic plates? To get the answer to that question you'll have to consult a specialist.
The subject of this simple blog post was not geology or earthquakes or HAARP or conspiracies, but a simple question about finding the data to fit a graph. Whenever you see data being presented online have a look at the original source, and even then double check that the raw data has been correctly represented and interpreted.
For lessons in data visualisations, and on how to abuse them, there is nobody better than Edward Tufte.
==
Below is the original post (indeed v1.0 and v1.1 with the link). All comments before 19 April refer to this post, and would make little sense without this post as reference. That some comments may make little sense anyway I leave to the reader's judgement.
==
While Haiti is still sorting out the chaos from its January earthquake, the Earth suffers another massive quake in Chile. At a magnitude of 8.8 on the Richter scale this is one of the most powerful earthquakes ever recorded. Concerns about a tsunami spreading across the Pacific have abated and the Chilean authorities claim they have the resources to handle the catastrophe.
Why are we having so many earthquakes recently? Is it just that the media likes to report dramatic and tragic events, or has there been a quantitative increase? The graph below tells a worrying story.
The graph is compiled from data from the US Geological Survey (USGS), which monitors earthquakes throughout the globe. The data goes back over 100 years and looks as if this was compiled in 2007 or 2008. The URL which it points to has worldwide data on earthquakes but no longer has a graphical representation. Perhaps the graph is so alarming the USGS decided not to show data in this way. Just to fill in the recent data: 2008 saw 35 earthquakes of magnitude 6 and over; and 2009 saw a record-breaking 52, taking it way off the above scale - you can go count them yourself!
This alarming increase seems to have started in 1999. The conspiracy theorists have been all over this like a rash and numerous fingers are pointing to HAARP technology. There is increasing evidence that HAARP technology can alter the weather, but can it cause earthquakes? Even the official literature states that starting in 1996 HAARP tested its capabilities for geological mapping using ELF waves by modulating the ambient current in the ionosphere using HF radio waves. The official HAARP website has some interesting simulations of the fields created in the Earth's ionosphere-magnetosphere. Weather modification is another hornet's nest so I'd like to keep this to earthquakes.
However, this isn't a conspiracy website, so are there any scientists in this field who can explain this huge spike in earthquakes? An artefact of more measuring stations, surely not?
Update: we seem to have some answers! The above graph is an artefact of selective data. As some readers don't go through all the comments here is the link to the relevant comment and a new graph.


Comments