


X-ray in characterization techniques
1. X-ray X-ray is a form of electromagnetic wave with wavelength in the range of 10 to 0.01 nm and energies in the range of 120 eV to 120 keV, shown in Fig. 1 [1]. It was emitted by the electrons outside the nucleus. Because of this, many material characterization techniques have been developed.
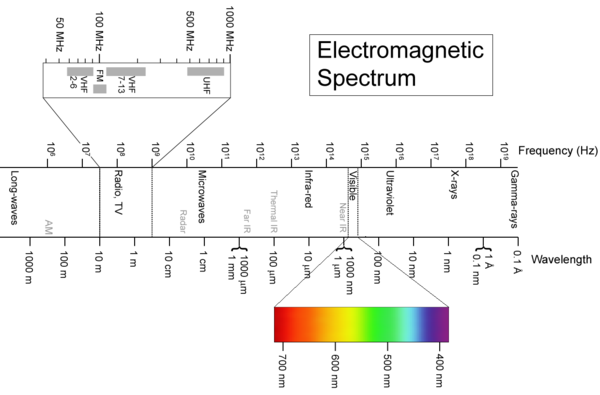
Fig. 1 Electromagnetic spectrum
2. Characterization techniques related to X-ray
2.1 XRD: X-ray Diffraction
As the wavelength of x-ray is comparable with the lattice parameter of crystals, diffractions can be happened when it interact with the sample surface. According to Bragg law, diffraction happens at
2dsinθ=nλ
With certain incoming x-ray wavelength (λ, for example, from Cu target we get x-ray with wavelength of 0.154 nm), the diffraction angle (θ) is related to the planar distance of crystals (d), as shown in Fig. 2 [2]. Thus from the diffraction spectrum, the information crystal structure can be obtained. XRD is a non-destructive analytical method which can be used to identify phase and orientation, determine structural properties, measure the thickness of thin film, estimate the size of nanoparticles, etc..
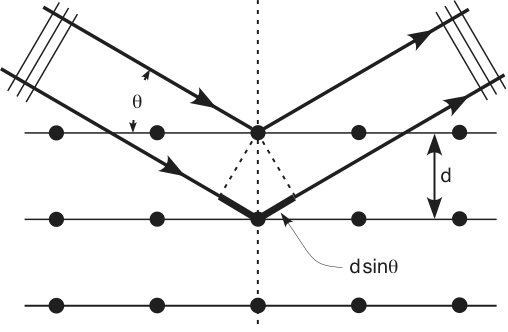
Fig. 2 Bragg diffraction
2.2 XAS: X-ray absorption spectrum
The origin of X-ray is from the radiation of electrons outside the nucleus. The energy of X-rays is thus comparable with the energy level of the electrons in the atoms. When it comes to a sample, it interacts with the electrons bound in an atom. In XAS case, the X-ray excites the electrons from core level to the unoccupied states (above Fermi energy), shown in Fig. 3a [3]. The spectrum records the normalized absorption as a function of the incoming X-ray energy. As the edges (K, L, M……) and the orbits (s, p, d……) of atoms have different energy level (Fig. 3b) [4], the photon energy of X-rays absorption can be used to determine the local geometric and/or electronic structure of matter.
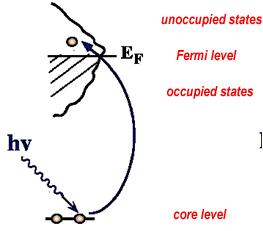
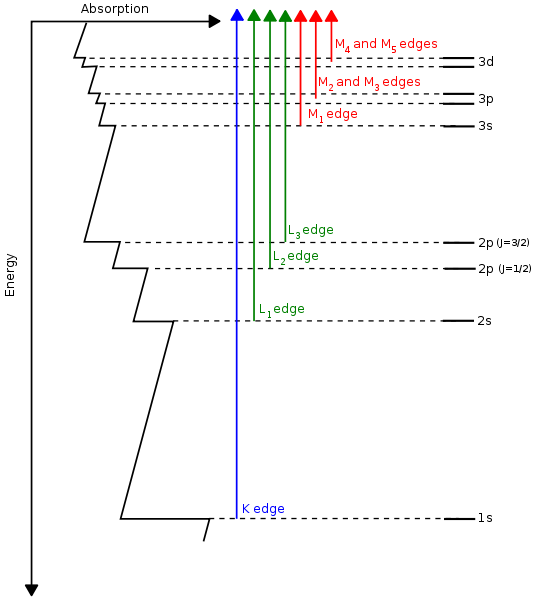
Fig. 3 a)X-ray absorption b)Energy level at different edges and atomic orbits
2.3 XPS: X-ray photoelectron spectrum
X-ray photoelectron spectrum (XPS) is based on the photon excited an electron and provides a core hole via ionization, as shown in Fig. 4 [5]. The electron binding energy can be calculated from the photon energy, kinetic energy of the emitted electron and the workfunction, and thus the atomic composition of a sample, or the chemical state of certain elements, can be determined. Thus XPS can be used to study the geometric, electronic and chemical properties of a sample.
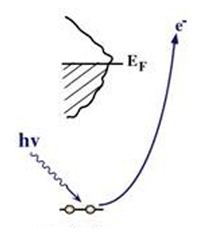
Fig. 4 X-ray photoelectrons
2.4 XES: X-ray emission spectrum
X-ray emission is the process of a valence electron goes into lower energy core hole which was created by X-ray absorption process and emit an x-ray with matching energy, as shown in Fig. 5 [3]. By detecting the emitted X-ray, the element specific information of local electronic structure can be obtained with no contribution from other atoms. It is therefore possible to detect the occupied valence states in an atom-specific projection.
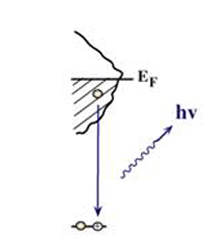
Fig. 5 X-ray emission
3. Different from Auger electrons
Auger electron spectroscopy is a common analytical technique used to study the surfaces of a sample. The difference between Auger process and X-ray process is shown in Fig. 6 [6]. When a vacancy produced in lower energy shell (core shell), electron at higher energy orbits will jump to the lower energy orbits at the same time energy will be released. In Auger process, the energy excited an electron (Auger electron) escaping from the orbit, while in X-ray process, the energy is released by radiating X-ray photons.
Fig. 6 Difference between Auger process and X-ray Process
References
[1] http://en.wikipedia.org/wiki/X-ray
[2] http://en.wikipedia.org/wiki/Bragg_diffraction
[3] http://www-ssrl.slac.stanford.edu/nilssongroup/nilsson_corespec.html
[4] http://en.wikipedia.org/wiki/X-ray_absorption_spectroscopy
[5] http://www.hkbu.edu.hk/~csar/xps.html
[6] http://www.eaglabs.com/training/tutorials/aes_theory_tutorial/process.php
Fig. 1 Electromagnetic spectrum
2. Characterization techniques related to X-ray
2.1 XRD: X-ray Diffraction
As the wavelength of x-ray is comparable with the lattice parameter of crystals, diffractions can be happened when it interact with the sample surface. According to Bragg law, diffraction happens at
2dsinθ=nλ
With certain incoming x-ray wavelength (λ, for example, from Cu target we get x-ray with wavelength of 0.154 nm), the diffraction angle (θ) is related to the planar distance of crystals (d), as shown in Fig. 2 [2]. Thus from the diffraction spectrum, the information crystal structure can be obtained. XRD is a non-destructive analytical method which can be used to identify phase and orientation, determine structural properties, measure the thickness of thin film, estimate the size of nanoparticles, etc..
Fig. 2 Bragg diffraction
2.2 XAS: X-ray absorption spectrum
The origin of X-ray is from the radiation of electrons outside the nucleus. The energy of X-rays is thus comparable with the energy level of the electrons in the atoms. When it comes to a sample, it interacts with the electrons bound in an atom. In XAS case, the X-ray excites the electrons from core level to the unoccupied states (above Fermi energy), shown in Fig. 3a [3]. The spectrum records the normalized absorption as a function of the incoming X-ray energy. As the edges (K, L, M……) and the orbits (s, p, d……) of atoms have different energy level (Fig. 3b) [4], the photon energy of X-rays absorption can be used to determine the local geometric and/or electronic structure of matter.
Fig. 3 a)X-ray absorption b)Energy level at different edges and atomic orbits
2.3 XPS: X-ray photoelectron spectrum
X-ray photoelectron spectrum (XPS) is based on the photon excited an electron and provides a core hole via ionization, as shown in Fig. 4 [5]. The electron binding energy can be calculated from the photon energy, kinetic energy of the emitted electron and the workfunction, and thus the atomic composition of a sample, or the chemical state of certain elements, can be determined. Thus XPS can be used to study the geometric, electronic and chemical properties of a sample.
Fig. 4 X-ray photoelectrons
2.4 XES: X-ray emission spectrum
X-ray emission is the process of a valence electron goes into lower energy core hole which was created by X-ray absorption process and emit an x-ray with matching energy, as shown in Fig. 5 [3]. By detecting the emitted X-ray, the element specific information of local electronic structure can be obtained with no contribution from other atoms. It is therefore possible to detect the occupied valence states in an atom-specific projection.
Fig. 5 X-ray emission
3. Different from Auger electrons
Auger electron spectroscopy is a common analytical technique used to study the surfaces of a sample. The difference between Auger process and X-ray process is shown in Fig. 6 [6]. When a vacancy produced in lower energy shell (core shell), electron at higher energy orbits will jump to the lower energy orbits at the same time energy will be released. In Auger process, the energy excited an electron (Auger electron) escaping from the orbit, while in X-ray process, the energy is released by radiating X-ray photons.
Fig. 6 Difference between Auger process and X-ray Process
References
[1] http://en.wikipedia.org/wiki/X-ray
[2] http://en.wikipedia.org/wiki/Bragg_diffraction
[3] http://www-ssrl.slac.stanford.edu/nilssongroup/nilsson_corespec.html
[4] http://en.wikipedia.org/wiki/X-ray_absorption_spectroscopy
[5] http://www.hkbu.edu.hk/~csar/xps.html
[6] http://www.eaglabs.com/training/tutorials/aes_theory_tutorial/process.php


Comments