


There hasn't been a lot of progress made on greenhouse gas emissions policies - while America and the EU have made efforts to curb emissions, three countries that account for 3X the emissions of the US are exempt from treaties under an umbrella of developing nation status.
And neither policy makers nor the public trusts climate science the way they do other fields.
What the world needs is globally consistent, independent emissions assessments - and a lot less self-reporting, errors and lack of verification.
Researchers are trying a new approach to estimating CO2 emissions from burning fossil fuels, called the "Fossil Fuel Data Assimilation System" (FFDAS). To calibrate it, they quantified 15 years of CO2 emissions, every hour, for the entire planet and down to the city scale. This would replace coarser scales that used less reliable techniques.
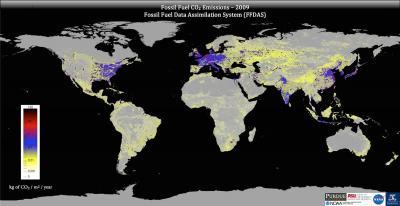
Global fossil fuel carbon dioxide emissions as represented by the Fossil Fuel Data Assimilation System. Credit: Gurney lab
The FFDAS uses information from satellite feeds, national fuel accounts, and a new global database on power plants to create high-resolution planetary maps. These maps provide a scientific, independent assessment of the planet's greenhouse gas emissions — something policy-makers can use and the public can understand.
The research team combined information from space-based "nighttime lights," a new population database, national statistics on fuel use, and a global database on power plants to create a CO2 emissions map broken down by hour, year and region.
"With this system, we are taking a big step toward creating a global monitoring system for greenhouse gases, something that is needed as the world considers how best to meet greenhouse gas reductions," said Kevin Robert Gurney, lead investigator and associate professor Arizona State University. "Now we can provide all countries with detailed information about their CO2 emissions and show that independent, scientific monitoring of greenhouse gases is possible."
"The accuracy of the FFDAS results is confirmed by independent, ground-based data in the United States," said Salvi Asefi-Najafabady, lead author of the report and postdoctoral researcher at ASU. "This makes us confident that the system is working well and can provide useable, policy-salient information."
"This is an incredibly helpful tool for national and international policymakers and the public to get a grasp of whether strategies to reduce greenhouse gases are effective," said Jennifer Morgan, Director of the Climate and Energy Program at World Resources Institute. "It serves as a complementary approach to current bottom-up accounting methodologies. No longer will there be a delay in understanding the latest GHG trends."
The FFDAS showed surprising detail on global emissions before and after the Global Financial Crisis, with portions of the U.S., Europe and India recovering sooner and more dramatically. The multiyear results also showed the dramatic rise of CO2 emissions in China and South Asia. Hence, the sub-national details offer insights into economic activity at scales for which traditional economic data has been limited.
"It used to take years to assemble all the statistics on CO2 emissions", said Peter Rayner, lead investigator from the University of Melbourne, Australia. "With this system, once the satellite data is flowing we can update our emissions maps each year. It gives a quick check on efforts to limit climate change."
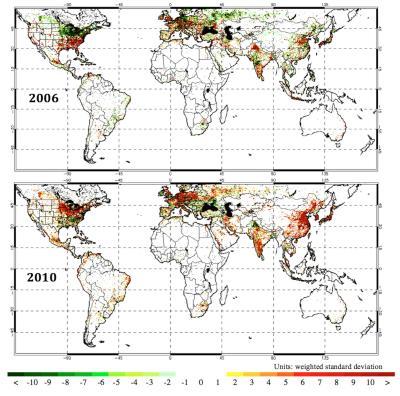
This image shows annual FFDAS fossil fuel CO2 emissions anomalies for two years on either side of the Global Financial Crisis. (a) 2006; (b) 2010. Units: weighted standard deviation. Credit: Gurney lab
Source: Arizona State University


Comments