


One of the common misconceptions about climate, brought about by the blight of 'framing' that afflicted science media in the last decade, is that the amount of carbon dioxide in the atmosphere, solar radiation and temperature follow each other – the more solar radiation and the more carbon dioxide, the hotter the temperature.
Climate experts always knew better but let the analogies go in hopes that it would get policy action done regarding too much CO2, but too much simplification has done more harm than good, and now more people than ever assume science is just another extension of politics - in issues ranging from the climate to genetic modification to vaccines and even energy policy.
It's not all wrong even if it's not always right - exceptions validate the rules, on occasion. In the
three kilometer thick
Greenland ice sheet, during a period of several thousand years up until the last ice age ended approximately 12,000 years ago, that elegant pattern did not fit and this was always a mystery to researchers. Researchers from the Niels Bohr Institute writing in Science now say they have some answers.
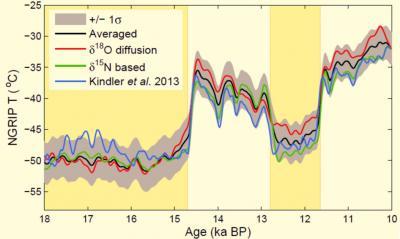
The revised Greenland temperature history (black curve, grey uncertainties) for the period 18,000 to 10,000 before present. This temperature history is based on temperature interpretation from nitrogen measurements (green curve) and O18 diffusion measurements (red curve). The blue curve is from a previous study, based on nitrogen measurements. Credit: Niels Bohr Institute
The Greenland ice sheet is an archive of knowledge about the Earth's climate more than 125,000 years back in time. The ice was formed by the precipitation that fell as snow from the clouds and remained year after year, gradually being compressed into ice. By drilling down through the approximately three kilometer thick ice sheet, the researchers draw up ice cores, which provide detailed knowledge of the climate of the past annual layer after annual layer. By measuring the content of the special oxygen isotope O18 in the ice cores, you can get information about the temperature in the past climate, year by year.
But something didn't fit. In Greenland, the end of the Ice Age started 15,000 years ago and the temperature rose quickly. Then it became colder again until 12,000 years ago, when there was again a rapid rise in temperature. The first rise in temperature is called the Bølling-Allerød interstadial and the second is called the Holocene interglacial.
Temperatures contrary to expectations
"We could see that the concentration of carbon dioxide and solar radiation was higher during the cold period between the two warm periods compared with the cold period before the first warming 15,000 years ago. But the temperature measurements based on the oxygen isotope O18 showed that the period between the two warm periods was colder than the cold period before the first warming 15,000 years ago. This was the exact opposite of what you would expect," explains postdoc Vasileios Gkinis, Centre for Ice and Climate, Niels Bohr Institute, University of Copenhagen.
The researchers investigated ice cores from three different Greenland ice cores: the NEEM project, the NGRIP project and the GISP 2 project. But amount of the oxygen isotope O18 was not enough to reconstruct period temperatures in detail or their geographic distribution.
To get more detailed temperature data, the researchers used two relatively new methods of investigation, both of which examine the layer of compressed granular snow that is formed between the top layer of soft and fluffy snow and the layer deeper down in the ice sheet, where the compressed snow has been turned into ice. This process of transforming the fluffy snow into hard ice is physical and both the thickness and the movement of the water molecules are dependent on the temperature.
"With the first method, we measured the nitrogen content and by measuring the relationship between the two isotopes of nitrogen, N15 and N14, we could reconstruct the thickness of the compressed snow 19,000 years back in time," explains Vasileios Gkinis.
The second method involved measuring the spread of air with water molecules with different isotope composition in the layers with the compressed snow. This process of smoothing the original water isotope variations from precipitation is dependent on the temperature, as the water molecules in vapour form are more mobile at warmer temperatures.
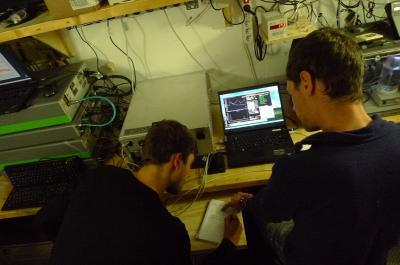
Measurements of the composition of the air bubbles in the ice core and the isotopic composition of the ice are carried out in the NEEM camp laboratory. Credit: Niels Bohr Institute
Temperatures 'fall into place'
Data for the spread of the water molecules in the individual annual layers in the Greenland ice cores has thus made it possible to calculate the temperature in the layers with compressed snow 19,000 years back in time.
"What we discovered was that the previous temperature curve, which was only based on the measurements of the oxygen isotope O18, was inaccurate. The oxygen temperature curve said that the climate in central Greenland was colder around 12,000 years ago than around 15,000 years ago, despite the fact that two key climate drivers – carbon dioxide in the atmosphere and solar radiation – would suggest the opposite. With our new, more direct reconstruction, we have been able to show that the climate in central Greenland was actually warmer around 12,000 years ago compared to 15,000 years ago. So the temperatures actually follow the solar radiation and the amount of carbon dioxide in the atmosphere. We estimate that the temperature difference was 2-6 degrees," says Bo Vinther, Associate Professor at the Centre for Ice and Climate at the Niels Bohr Institute, University of Copenhagen.


Comments