What big environmental win has happened in the last 10 years for Americans? Most importantly, the country switched to natural gas from coal, and that is a good thing because emissions from energy plummeted, and a lot of manufacturing has left the country due to a punitive regulatory environment, that is bad, but the upside has been a reduction in pollution across the country.
New satellite images from
the Ozone Monitoring Instrument (OMI) on NASA's Aura satellite
demonstrate the reduction of air pollution across the country.
After ten years in orbit, has been in orbit sufficiently long to show that people in major U.S. cities are breathing less nitrogen dioxide – a yellow-brown gas that can cause respiratory problems.
Nitrogen dioxide is one of the six common pollutants regulated by the U.S. Environmental Protection Agency (EPA) to protect human health. Alone it can impact the respiratory system, but it also contributes to the formation of other pollutants including ground-level ozone and particulates, which also carry adverse health effects. The gas is produced primarily during the combustion of gasoline in vehicle engines and coal in power plants. It's also a good proxy for the presence of air pollution in general.
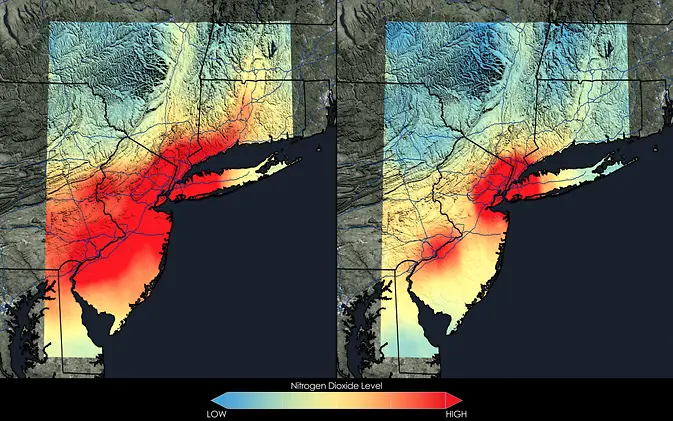
Satellite data show that New York City has seen a 32 percent decrease in nitrogen dioxide between the 2005-2007 (left) and 2009-2011 (right) periods. The city tops the charts in terms of U.S. population, which usually means more air pollution. Even here, however, the air is on the mend. Credit: NASA Goddard's Scientific Visualization Studio/T. Schindler
Air pollution has decreased even though population and the number of cars on the roads have increased. The shift is the result of regulations, technology improvements and economic changes, scientists say.
In fact, about 142 million people still lived in areas in the United States with unhealthy levels of air pollution, according to the EPA. Also, high levels of air pollution remain an issue in many other parts of the world, according to the global view from satellites.
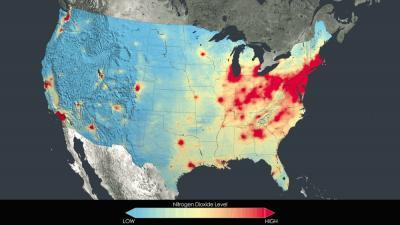
Nitrogen dioxide pollution, averaged yearly from 2005-2011, has decreased across the United States. Credit: NASA Goddard's Scientific Visualization Studio/T. Schindler
"While our air quality has certainly improved over the last few decades, there is still work to do – ozone and particulate matter are still problems," said Bryan Duncan, an atmospheric scientist at NASA's Goddard Space Flight Center in Greenbelt, Maryland.
Decision makers and regulatory agencies like EPA have long relied on data from ground sites to inform air quality science and forecasts. NASA, while not directly involved with regulation or making forecasts, provides a consistent, global, space-based view – not possible from any other source – of when and where air pollution occurs. For example, NASA observations of air quality helped inform a Supreme Court ruling on April 29, 2014, that upheld an EPA regulation that seeks to lower cross-state air pollution.
Another ongoing effort by NASA to study air quality is Discover-AQ, a multi-year airborne mission flying this summer in Denver to learn more about how the wide range of air pollutants viewed from satellites relates to what's happening close to the ground where people live and breathe. The mission flew previously in 2011 over Baltimore, Maryland and Washington, D.C.; in 2013 over the San Joaquin Valley, California; and in 2013 over Houston, Texas.
[image-51"You can't control what you don't measure," said Russ Dickerson of the University of Maryland, College Park, and member of the NASA Air Quality Applied Sciences Team – created in 2011 by the NASA Applied Sciences Program to serve the needs of U.S. air quality management through the use of Earth Science satellite data, suborbital, and models. "NASA measurements of air quality have value to the people with the authority to control emissions and develop policy."
The new NASA images also take a close up look at the Ohio River Valley, Northeast Corridor, and some populous U.S. cities. They show how nitrogen dioxide concentrations during spring and summer months, averaged from 2005-2007, compare to the average from 2009-2011.
Measurements of nitrogen dioxide from OMI depict the concentration of the gas throughout a column of air in the troposphere, Earth's lowest atmospheric layer. The images are color-coded: Blue and green denote lower concentrations and orange and red denote higher concentrations, ranging from 1x10¹⁵ to 5x10¹⁵ molecules per square centimeter, respectively.
Images were composed by NASA's Scientific Visualization Studio based on data and input provided by atmospheric scientists Yasuko Yoshida, Lok Lamsal, and Bryan Duncan, all of NASA's Goddard Space Flight Center in Greenbelt, Maryland.


