

Kai had to withstand a very long review process within the collaboration before the evidence for the new particle could finally be published; and the addition of more data to the analysis, one year afterwards, left many in CDF with the suspect that the particle was maybe there only in the eye of the beholder: the new data did not seem to show a clear hint of the peak seen in the first part.
Despite that, CDF ended up publishing the result of the full analysis, which -when the background was fit with a more "physics motivated" and less conservative function- yielded a larger statistical significance for the observed effect. It was a somewhat controversial situation.
After the publication by CDF, many experiments produced searches for the structure. While CMS soon showed a confirming signal in its data, and hints of a second resonance some 130 MeV more massive, the LHCb collaboration denied the presence of the signals. DZERO later confirmed the CDF find.
Overall the picture could have been more clear with four experiments carefully looking at similar data, and some have continued to speculate that the structures are not particles but deformations of the kinematical distributions of the bodies produced in B hadron decays, due to non-well-understood dynamical effects. To me, the Y(4140) and Y(4270) look like well-established resonances, and I do not understand the objections, although maybe I am just being a bit naive. The most interesting thing to me remains that LHCb, which of the four above experiments is the one allegedly better equipped to do B physics, is the one which has failed to see anything; it looks as if the anomaly is in the LHCb field now...
In the meantime another B physics dedicated experiment, BaBar, has looked for the Y states in its data sample, and has found results which are still open to different interpretations; but again I take them as a further positive confirmation of the original CDF signal.
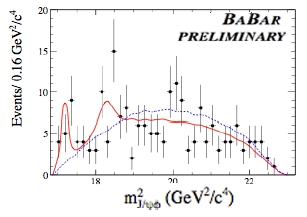 The mass distribution extracted by BaBar is shown on the right. As usual, black points are experimental data; the red curve is the interpretation which includes the two structures, while the blue curve is a background-only model. As you can see, a fit which includes the two resonant structures is a much better model of the data than a simple "phase space" potato-like distribution.
Note that in the above graph BaBar histograms the squared mass, for reasons that I will not explain here. Also note that Babar uses the reproachable habit of plotting sqrt(N) error bars on their data. This is IMO deceiving, and frankly very unfortunate. Let me turn the diatriba mode on in the next paragraph to explain what I mean.
Diatriba mode on
When one chooses to plot a point with an error bar in a histogram representing event counts, one is plotting two things at once, whether one knows it or not. In each bin, the point shows both the observed event counts -a number with no error- and the Maximum Likelihood Estimate (MLE) for the Poisson mean μ of the process that has yielded those counts in that bin. The two are coincident.
Note that the former has no error. The latter does, and so one can proceed to attach an error bar to the point. I stress that the bar is of course relevant to the MLE, not the observed count which, I repeat, has no error. So this error bars is supposed to represent a range of possible values for the Poisson mean μ. Since in the absence of a specification the error bar is supposed to "cover" 68% of the possible values (as the integral of a Gaussian between -1σ and +1σ), that is what we expect the bars to do in the graph. But they do not ! In situations with very small event counts, an error bar from "μ-sqrt(μ)" and "μ+sqrt(μ)" as plotted above has very bad coverage properties. In other words, the bar represent a much smaller variation of possible μ values than what authors imply. Not 68% but in some cases much less.
The solution, due to Garwood, is 80 years old. It is to plot "central" asymmetric error bars which correctly cover at 68%. These are extracted by a simple rule by the inversion of the so-called "Neyman construction". Leaving that detail aside, it is very annoying to see otherwise respected particle physics experiments letting go with these perfectible graphs.
If you think this is a arguable detail think better: those error bars are there for a purpose, and they should not be deceiving. In particular, when one overlays a maximum likelihood fit to the points, the eye of the "user" will instinctively compare the curve with how much the points scatter around it. Error bars that undercover will lead the user to conclude that the fit is a poor one - but the fit used the Poisson distribution of the data, not the Gaussian approximation sqrt(N) ! Take e.g. the point at abscissa 19 in the graph below: it seems like it is 3- or 4-standard deviations away from the red fit, but a correct-coverage error bar would have made it clear that the disagreement is not large.
If you think that asymmetric error bars "confuse the user", you are deluded. We routinely publish confidence intervals in our HEP results, and now in a histogram we should "protect the user" who, poor soul, would get confused by a non-sqrt(N) error bar ? Come on. Fix those error bars, BaBar friends !
Back to the Y states
If they size up the signals, they come up with the following estimates for the fraction of "resonant" contributions: f(4140) = 7.3%, f(4270)=7.7%. Both estimates come with a largish error, respectively 4.5% and 6.4% (where I have combined statistical and systematical errors). Let us look also at the other experiments: they find
exp Y(4140) fraction / Y(4270 fraction)
----------------------------------------------------
CDF: 14.9+-3.8% / N/A
DZERO: 19+-8% / N/A
CMS: 13.4+-3% / 18.0+-7.3%
LHCb: < 7% / < 8%
(Disclaimer of liability: Note that I am relying on information from a talk by Elisa Fioravanti at Lake Louise, here; the CMS numbers are her estimates and I take no responsibility for those numbers - in fact I am too lazy today to go and check them).
Excluding LHCb, it seems as if the Y(4140) is a well-established structure appearing in a 14% fraction of the decays, and the Y(4270) is no less solid, and it appears in a similar fraction of the decays. Including LHCb, the five datasets appear slightly inconsistent, although not enough to doubt that the structures are real. That is at least my very personal interpretation of the state of matters.


Comments