

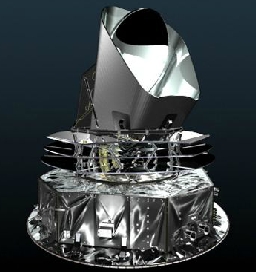
 The Planck collaboration has released today data from the first 16 months of operation of their space instrument (see left). There will be a live streaming of their announcements to the public in 1.5 hours at this link.
The data collected by Planck are a huge amount of information on the sky at a unprecedented level of resolution. To navigate through this we will need the word of the experts; I will update this post in a few hours to comment on the most interesting results. A picture of the cosmic microwave spectrum, taken from the freshly released results (see here to get your own pic of the universe according to your likings) is shown below.

The cosmic microwave background, discovered fortuitously in 1964 by Penzias and Wilson as a "noise" corresponding to a 3-degree Kelvin radiation coming from all directions of space, is the relic image of the Big Bang, created when the Universe became transparent to radiation. The WMAP collaboration was the last collaboration to produce in the past a very detailed map of the appearing direction of arrival of this radiation, evidencing anisotropies in the angular distribution which can be studied in detail to match predictions of our cosmological models. With Planck, however, we are going much deeper in the precision of these measurements, and we are going to learn a lot more about the Universe.
Although the data seem to confirm the standard model of Cosmology, one of the things that Planck is seeing is an anomaly in the large-scale structure of the microwave radiation spectrum. Also, some features already hinted at by the WMAP data are confirmed with high accuracy and hint at the need of some rethink of our models. More commentary in a couple of hours!
Update:
Okay, so I listened to the live stream of the press conference, and wrote down some notes, for those of you who did not have a chance to listen to it. Please excuse any typos or other mistakes in the reporting... Several speakers alternated and discussed the results at different levels of complexity.
Jan Tauber:
Planck was conceived more than 20 years ago, in 1992, and approved in 1996. Launched in 2009. Gathered data for over twice the amount of time it was originally designed for, and in fact will continue taking data.
Planck is a collaborative effort, and it has involved thousands of engineers and hundreds of scientists all over the world. Planck is aimed at measuring the temperature anisotropy to a level of precision not limited by the instrument but by the sky itself.
The main product of this investigation is nine maps of the whole sky, at different frequencies. The angular resolution designed to retrieve all the information that we can. Also measuring polarization. Not talking about polarization results today, because that set of data not yet delivered; we will hear about that in some time.
The nine maps allow to study the CMB anisotropy in the greatest detail. Information to cosmologists and astronomers as well.
Once we clean the milky way out of the maps we get the temperature variation of the CMB radiation. This is the map that cosmologists use to extract statistical information, the angular power spectrum that embodies all the information. Cosmologists extract the fraction of Dark Matter and Dark Energy from it, as well as the other parameters of the standard model of our universe.
Structured matter in the universe is distorting slightly the features of the CMB. We can clean it out and map the integrated distribution of matter. Maps of emission from the milky way have also been extracted. Plus compact galactic and extragalactic sources: a big array of sources of widely different nature. Also with a special technique they can detect clusters of galaxies (SZ effect), extracting a catalog of that too.
In 2014 they will release all the data both in temperature and in polarization.
Francois Bouchet
What is there to be seen in the CMB map ? Most is pristine information, not from 380000 years after the BB, but about the first instants of life of the BB (10^-30 to 10^-12 seconds). Quantum fluctuations are imprinted there.
We cannot predict the map of the anisotropies, but we can predict its statistical properties. With six parameters we can have hundreds of millions of possible peak structures and we find the one that matches the data best.
Three parameters are enough to generate the dynamics of the Universe from general relativity. Then there is the optical depth. And then two characterize the primordial fluctuations.
The departure of the parameter "ns" from 1 is a measure of departure from scale invariance as a function of length scale (angular scale).
The sound horizon theta is determined with 0.05% precision. Exact scale invariance of the primordial fluctuations is ruled out at over 7-sigma significance.
The expansion rate of the universe, H0, has decreased from earlier measurements. 67 km s-1 Mpc-1.
Planck data and Baryon Acoustic Oscillation measurements are in tight agreement.
So in summary there is no compelling evidence for any extensions of the standard cosmological model.
About the amount of gravitational waves and departure from scale invariance graph: one would expect in the 70s that we'd be in the lower right corner of the money plot (ns=1). Now Planck says that the primordial tilt ns is 0.965, and best fit is tensor to scalar ratio of 0. Consistent with single field slow roll, standard kinetic term, and vacuum.
With polarization they looked at the small-scale prediction at hot spots. Planck sees precisely the dynamics of fluctuations at 380000 years. It's amazing how well these match expectations.
That tells us two things: it is clear confirmation of the theory we are using, and bodes very well for the next year when we'll analyze the polarization at all scales.
One surprise we did not find in our catalog of models is in large scale anisotropies. We would have expected a better fit. Not overwhelming evidence, but statistically it does not happen often, a p<1% effect.
In summary, exact scale invariance is ruled out, ns<1, at >4sigma by Planck alone, >5.4 sigma with inclusion of WMAP polarization. Exact scale invariance is ruled out. No evidence for additional neutrino-like relativistic particles beyond the three families of neutrinos in the SM.
Paolo Natoli
The Universe might not be so simple, and Planck data might be telling us that theory needs to be improved. Fluctuations in the temperature at low multipole (large angular scales) are lower than the model. A rescaling of the power spectrum in amplitude does not work well to remove the discrepancy. There is a 99% chance that the amplitude is not 1 at the large angular scales.
Another thing is to test the Gaussianity of the CMB power spectrum. One wants to know if it follows a Gaussian distribution. Want to know if microwave background is Gaussian in its flukes or not. One of the predictions of near perfect Gaussianity is a prediction of the inflationary model.
To test Gaussianity one must measure two angles. The bispectrum measured by Planck can be used to constrain models of non Gaussianity. This is summarized in the parameter f_NL, measured at 2.7+-5.8, so consistent with zero: flukes are consistent with the Gaussian assumption. This is yet another confirmation of the inflation theory.
One can also do tests of isotropy: one can study the power function in two hemispheres and compare them. The degree of incompatibility is of the same order of the lambda_CDM anomaly at large angles.
Simon White
Planck provides us with a Picture of the sky in 9 colours.
Gravitational effects of intervening matter bend the path of CMB light on its way from the early universe to the Planck telescope. This gravitational lensing distorts our image of the CMB. If you knew what you are looking through, you could correct for this effect. Some regions are magnified, some are demagnified; only by a small amount, but one which Planck can measure.
By measuring this effect we can infer something about the average density of all matter in between. So we can construct a map of all the mass of the universe. It is approximate because it is "noisy": it depends on your knowledge of the map without the matter effect.
One may measure the typical fluctuations in mass as a function of angular scale. It determines the clumpiness in the modern universe measured through gravitational lensing. This is perfectly well predicted by the model.
Another thing Planck did is to map big galaxy clusters. The nearest very massive one is the coma cluster. This allows to map the matter distribution to much farther from the center of the cluster than previously possible.
Jean Loup Puqet
How do we get such an amazing sensitivity ? It is an interesting question to understand the data. Cooling the detector down to 0.1 degrees above absolute zero is one ingredient. Another is the stability of the instrument: temperature is stable down to a part per million. The strength of the instrument is its reliance on different technologies. The same regions of the sky are measured many times over and over, so we know our stability quite well.
Cosmic rays, modulated by solar wind, can affect the temperature stability. But these effects are under control and determine small systematic effects.
There are about 5 million pixels in the sky map. In each one can see deviations one million times smaller than the average intensity of the CMB.
---


Comments