

A trivial demonstration of the above fact is the following. Consider you are measuring the mass of the top quark (why, I know you do it at least once a week, just to keep mentally fit). You could say you have no idea whatsoever of what the top mass is, but you are capable of guessing, and your best guess is that the top mass is twice the mass of the W boson: after all, you have read somewhere that the top quark decays into a W boson plus other stuff, so a good first-order estimate is 2x80.4= 160.8 GeV.
With your guess, you would have gotten quite close to the real value -which the PDG tells us is 173.1 GeV, give or take 1.5 GeV-by sheer luck. But since a measurement is not complete without a determination of its uncertainty, you are now in a bind. What is the uncertainty on your estimate ? Of course you could guesstimate that too, for instance +-80.4 GeV -after all, the top mass could be three times the W mass, but not less than the W mass itself: so 2+-1 W masses sounds right.
Now, from a scientific standpoint, the central value of your "measurement" might well be legitimate (although nit-pickers would call it an indirect one), but the uncertainty is much less so. That is because the uncertainty is more important than the central value itself: we rely on the former to know how much we can trust the latter. The point is that even a guessed measurement is valuable, if its uncertainty is correctly assessed -that is, if the uncertainty reflects the possible range of values that our measurement could have taken (and their relative probability), had we redone it, or done it with a different instrument. My bottom-line is that guessing the uncertainty is more scientifically reproachable than guessing the central value.
With the above argument I may or I may not have convinced the seven of you who were not sleeping. Not to worry: to make my point stronger on how the assessment of systematic uncertainties is crucial in scientific measurements, in this article I am going to reverse engineer the top quark mass measurements that the CDF and DZERO collaborations have produced since 1994.
A simple exercise, an intriguing result
We have the luxury of being able to look back to 15 years of determinations of the top quark mass: more than 30 independent or partly-dependent results have been produced on it. They are summarized in the top quark section of the Review of Particle Properties, the bible of particle physicists, a thick book which contains everything that has been measured on subatomic particles.
With so many measurements, performed in part at a time when the real value of the top quark was not so well known as now, and with the knowledge of the true top mass (the value is known to within a +-1.5 GeV interval, thanks to careful average of the most precise new numbers published by the Tevatron experiments) we can assess whether the published systematic uncertainties attached by CDF and by DZERO to their top mass determinations were probably underestimated, overestimated, or roughly ok.
How can we do that ? Simple. First of all, let us take from the PDG the results by CDF and DZERO which have not been used to compute the current World average. Here they are:
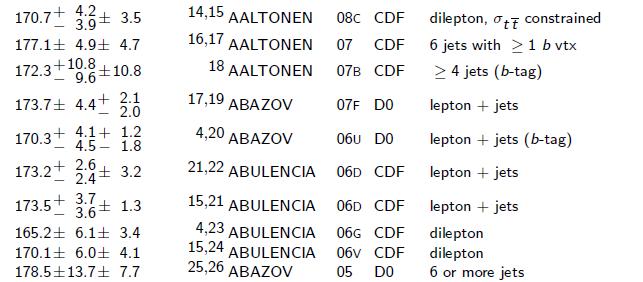
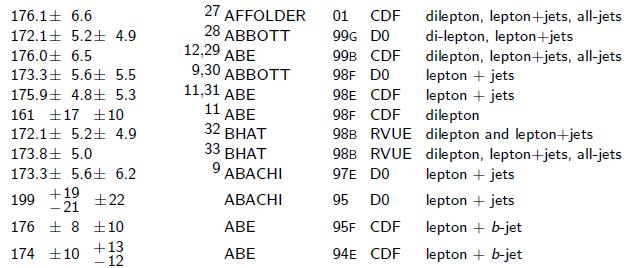
In the above list appear combinations and other revue numbers. We need to take those off, since they are strongly correlated with other numbers in the list. A total of 11 CDF measurements and 6 DZERO measurements remain. That is our base of data.
What do we do with those numbers ? Consider the second one, which reads
Now, from the World average we know that the real top mass is 173.1 GeV with a 1.5 GeV uncertainty: so we pick at random a "true" mass value from a Gaussian function of average 173.1 GeV and width 1.5 GeV, and similarly pick at random a "measured" mass value from another Gaussian function of average 177.1 GeV and width of 4.9 GeV. We thus leave out the systematic uncertainty part, which we want to study.
We then proceed and compare the two numbers: say we got a true value of 172.5 GeV, and a measured one of 178.5 GeV. We can divide the difference, 6.0 GeV, by the total uncertainty, which includes the systematic term, and equals
One single run of the above exercise says next to nothing about the uncertainties. However, if we do the same thing many times, for all the measurements that the CDF or the DZERO experiments produced of the top quark mass, we get a long collection of "normalized deviations", which assume some meaning. In fact, if the systematic uncertainties of those measurements were assessed correctly, one would expect that the resulting distribution of deviations would be a perfect Gaussian, with a width of 1.0.
Instead, in the case when one experiment tended to under-estimate its systematic uncertainties, one would find a distribution with a width larger than 1.0; in the opposite case, of an over-conservative experiment, the resulting distribution would be narrower than the standard Gaussian.
Before going to the results, let me mention that this exercise is not too deep, and has several shortcomings. That is, I need to clarify here that all I am doing is to compare a bunch of results with the world average, and I do not claim that the very simple-minded procedure I have put together is too meaningful. I would be able to fill a few pages of text by listing the caveats (correlated systematics among different measurements, assumption of Gaussianicity, etcetera, etcetera, etcetera..., etcetera); however, the good thing about a blog is that one can be a bit more relaxed about what one publishes there. So here we go.
The Results
 We first consider the DZERO experiment. We have only six top mass results with which to play, but by the toy Monte Carlo approach I have outlined above, we still get a rather smooth distribution of "pseudo-deviations". As you can see, the average is centred more or less well at zero: this is not too meaningful by itself -the six measurements will in general have an average that is above or below the world average mass of the top quark, and this will indeed reflect in the average of the distribution you are looking at.
 More interesting is to check the RMS, which is printed on the top right corner. We get a result of 1.136: larger than one. This means that on average, the six DZERO results underestimated a bit their systematical uncertainties. Not by too much, but significantly so: if we assume that statistics and systematic errors are contributing equally to the width, the systematics are underestimated by 26% to get the result above. But do not forget the caveats I discussed previously...
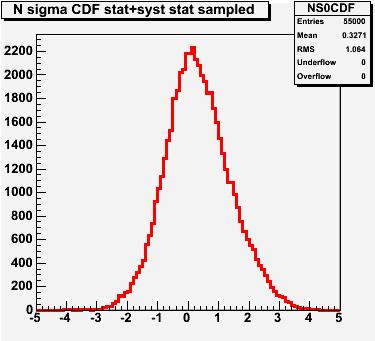 Next, let us look at the CDF distribution: here, we get a slightly larger offset -0.33 standard deviations away from the World average; just a result of the way the 11 results used for this exercise were selected. Instead, the RMS of CDF is better: it is 1.064, definitely closer to 1.0. CDF, as DZERO, underestimates its systematic uncertainties on the top mass, but about half as much as DZERO.
Ok, the exercise above is a bit too hand waving to be really meaningful. All I meant to do with it today is to make a point about the fact that the scientific integrity of experiments does one day appear, to those who have eyes to see. From the a posteriori perspective, many things can be said of past measurements. In fact, the PDG already does something similar to what I have offered here today in its pages: a comparison of the measured value of several physical quantities is shown as a function of time, to highlight the biasing effect that the knowledge of past results has in the publication of new ones.
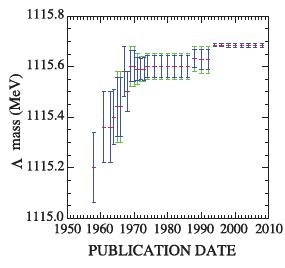 Take the example shown in the plot on the right as a telling case: it shows the mass of the Lambda hyperon as a function of time. The trend in the mass versus time does not mean that the Lambda fattened in the last forty years, but rather that past determinations clearly influenced the following ones... I can imagine somebody measuring the Lambda mass to be significantly higher than the previously known World average, and then saying: "It is too high! We certainly have got the scale of our magnetic fiend wrong..."
Plots such as the one above are a very clear warning to experimenters: trust your data, not external inputs!


Comments