

DESCRIBING THE SOLAR CYCLE
No matter how it may seem in mid-July, the Sun is not just a perfect sphere sending a constant stream of merciless heat our way. The turbulent activity on its surface waxes and wanes over roughly 11 years, a behaviour well known as the solar cycle or often the 11-year cycle. This variation was first seen in the number of sunspots, which have been recorded for some centuries, and more recently in solar flares, storms, radio bursts and their like, while it even shapes tourists’ plans for traveling to see the northern lights.
Today it is clear that the source of the cycle lies in the Sun’s magnetic dynamo mechanism with its shifting magnetic fields and googlilion tons of moving plasma. Stellar cycles are even being recorded. But do we know why the duration and the intensity differ liberally from cycle to cycle, why their patterns repeat over centuries, or even why 11 years? We don’t and, more dramatically, existing models – based mostly on previous numbers of sunspots and on geomagnetic activity – give diverging predictions.
Starting point
I recently worked on a model with the goal of describing and predicting the evolution of individual cycles down to a “resolution” of a few months. The model is phenomenological, in the sense that it deals with appearances instead of underlying causes, and it uses the records of the most intense solar flares, known as M and X classes; the strongest among them can cause solar storms and can occur several times per day at the maximum of cycles or be absent for weeks at their minimum. Solar flares have been recorded by the GOES satellites continuously since 1976, covering the latest four cycles, numbered 21-24.
One of the model’s main elements is the relative motion of the planets Jupiter and Saturn. Its introduction was due to two observations: First, recent indications that the relation between the appearance of solar flares and the positions of the innermost planets is highly non-random. And second, the following empirical point.
If the number of flares is plotted against the relative angle of the two gas giant planets, as in the figure below, a striking peaking of activity appears around their alignments, with a gradual decrease as they move away from them until the flares all but disappear around normal relative angles (angles refer to the ecliptic longitude). However, if the plot is broken down into the four cycles, the peak of activity is progressively ‘dragged’ further away from the alignment dates, at the same time that the overall strength of the cycle diminishes.
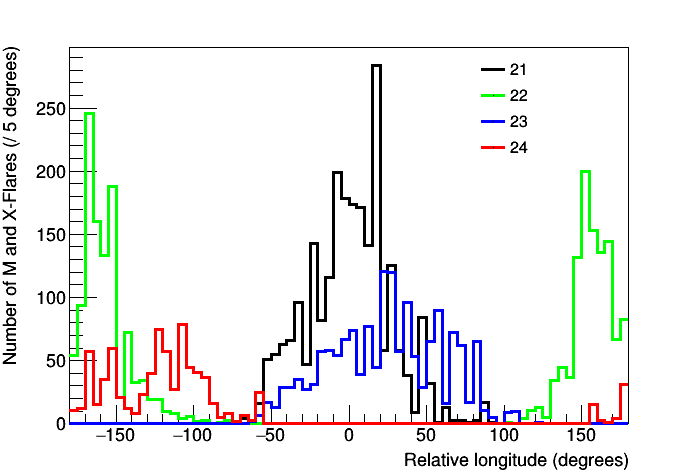
Fig. 1 – Solar flares (of intensity classes M and X) since 1977 plotted against the relative angle between Jupiter and Saturn.
Can it be that we are in fact watching the coupled result of two effects, namely an internal solar component and the approach and retreat of the two planets? Let’s see how this empirical hypothesis can be put into math and tested.
Model building
So, we want to see if the long-term evolution of solar activity is the result of a coupling between two components, which repeat at specific (albeit not constant) time intervals. If one of the components is related to the relative motion of Jupiter and Saturn, then it is expected to be stronger around the dates of their alignments and cover mostly the time range between their relative -/+45o (~2,000 days), as seen from the first plot. If the other component is associated with an internal solar effect (undefined so far, but presumably of magnetic origin), then it is expected to be stronger around the cycles’ temporal middles and, empirically, cover mostly ~3,000 days. A note here: the temporal middle is defined as the middle between the first flare of a cycle and that of the next one (another quick note – different cycles are marked unambiguously by the polarity of their sunspots).
Now, when one seeks to quantify unknown physical processes, the go-to distribution is the Gaussian distribution, and the assumptions above just gave us the means of two candidate Gaussians and ballparks for their two-standard-deviations range. With these assumptions, two fits on the observations from cycle 21 can provide us with two functions to describe the hypothesized components, shown below. Why cycle 21? Because in that friendly cycle the dates of the alignment and of the cycle’s middle fell close, at less than one year apart, so it is assumed that both components could manifest in almost their full scope. (Is such an expectation a logical jump? Perhaps, but stay tuned for a couple more paragraphs ...)
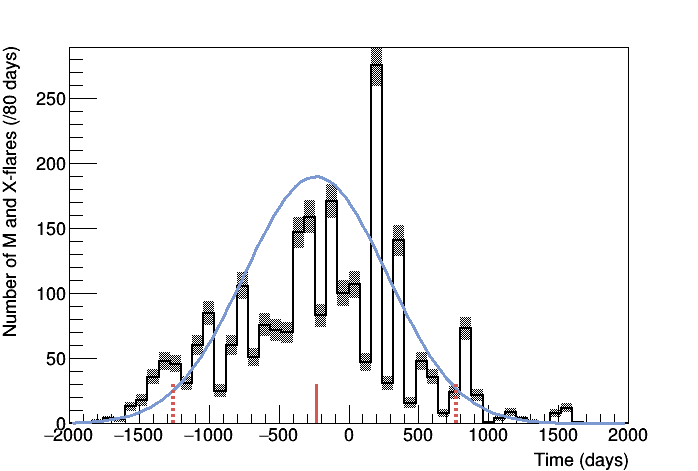
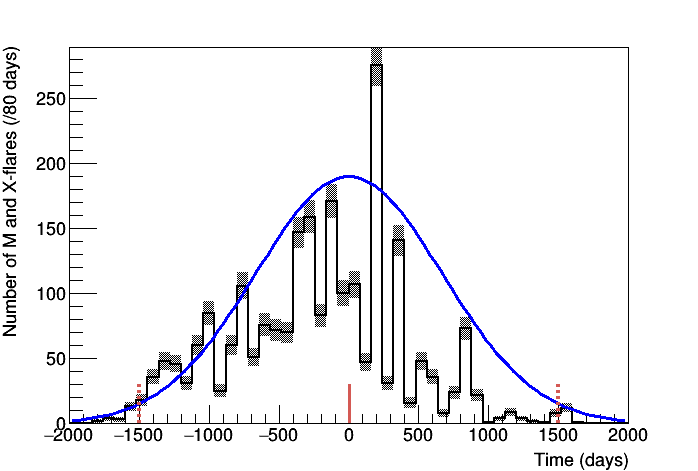
Fig. 2 – Flares of cycle 21 centered on its temporal middle and the extracted Gaussian functions. The centerings and fitting ranges are marked for the Jupiter-Saturn component (top) and the internal component (bottom).
The two functions can easily be cloned on an axis of time, with the planetary component centered on the dates of alignments and the internal solar component centered on, well, the cycles’ middles. This leads to the distribution in the plot below. The only initial assumption left to quantify is the coupling between the two components; this will simply be their common area, outlined here:

Fig. 3
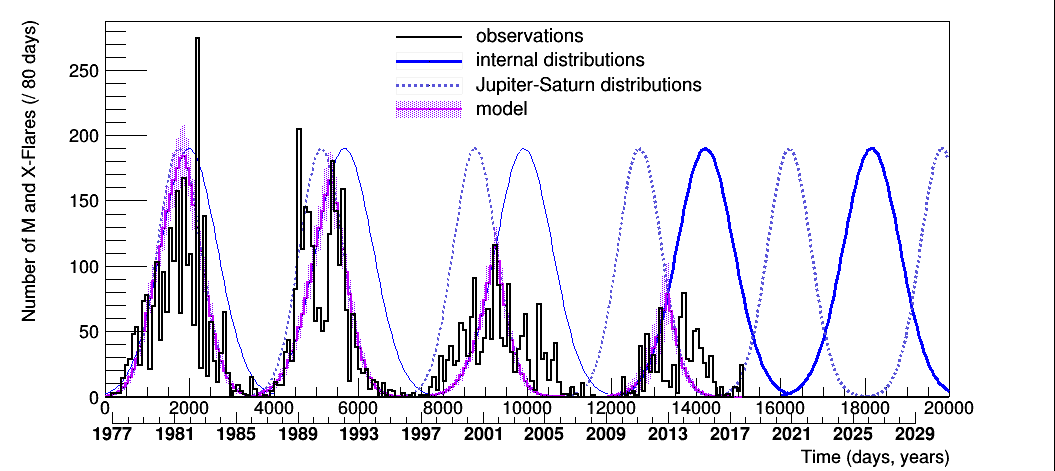
This last distribution, i.e. the common area of the Gaussians extracted from cycle 21 and then appropriately timed, is proposed to model the evolution of solar activity in terms of flares. Then, after sprinkling it with the relevant uncertainty, let’s plot it together with the observational data:
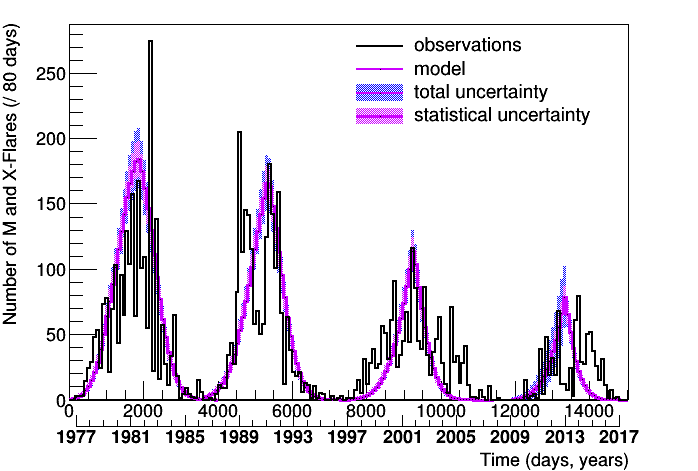
– Fig. 4 –
The agreement is quite good-looking in the timing and intensity, as well as general evolution. Certain irregularities are also compatible with the model, like the ‘deep minimum’ before cycle 24, the lowest in solar activity in the last hundred years. For sure the short-scale divergence from the model had better be understood, although the random character of such a (very) real physical system should also be taken into account.
Where does one go from here? Statistical tests support the case that the match in the last plot isn’t a result of chance, but four cycles are obviously too small a number for conclusions. A good addition would be a check against the available twenty earlier cycles; the obstacle here is that there exists no rule for correspondence between the distributions of flares and sunspots, and earlier observations comprise of sunspots. An alternative to this would be to use records of past geomagnetic activity, which is indirectly related to that of flares. A more exotic idea is to check with stellar flares at systems with exoplanets. A more amusing one is to make predictions.
Predictions
So far I haven’t talked about where cycle 24’s middle is. After all, it is ongoing and stuff, however there is still something predictable about it: the time lengths of consecutive Jupiter-Saturn alignments and of the cycle duration are not equal of course and their difference increases by 396 days on average with each cycle. This number was used for estimating the middle of cycle 24. (Naturally a related amount of uncertainty was assigned to the model for this estimation; by the way, another source of systematic uncertainty comes from binning the data into histograms; a fact that I feel should have been mentioned earlier, given the threats often expressed in this blog against poor use of statistics!)
What’s more, the same estimation can be used for the middle of cycle 25, extending the model beyond the range that it was initially developed on. This is plotted here along with the observations after 2016:
– Fig. 5 –
While still in cycle 24, a surge in activity in late 2017 was both pleasantly compatible with the prediction and surprising under the standard solar cycle theory as it happened during the ‘solar minimum’. The novel factor here is the overlap with two planetary Gaussians, occurring in both the current and the next cycle. It now remains to watch the evolution over the following years …
Beyond
Of course, the ultimate check (and goal) would be to uncover the physical mechanism at play and test other aspects of it. What kind of mechanism could be compatible with this claim, I am not able to say so far - but there are a few stylish ideas on the table. The same goes for expressing it as the common area of two temporal distributions, although the similarity to signal filtering can be pointed out. Likewise, I like to imagine that an inherent oscillating mechanism in the Sun is actually ‘passed through’ an external trigger. And in terms of perturbations acting on it, the presence of planets, albeit small, is one of the few conceivable steady and punctual sources.
This is the reason that a planetary-solar connection has often been brought up in the past but almost always within numerical or frequency analyses. The data available were not conductive to much more as sunspots are mostly appearances, indirect indicators of solar turbulence. On the other hand, solar flares are definite events; it might be that after four decades of collecting them the time is right to start seeing what they have to say.
Full article in the Journal of Atmospheric and Solar-Terrestrial Physics: https://doi.org/10.1016/j.jastp.2018.06.010 arXiv preprints: https://arxiv.org/abs/1702.00641


Comments