The LHC is taking data. What, again?
As Run 3 of the LHC has recently started, maybe I should explain how we do business in particle collisions at CERN first and foremost. When the LHC was first turned on 12 years ago, media around the world were busy explaining the magnitude of the experimental apparatus, the challenges, and even the alleged dangers of reaching to collision energies until then never achieved. Then, the Higgs discovery brought the experiments under the spotlights again in 2012. To bystanders, the fact that after a decade those experiments are still going on might look strange: what are they doing? Haven't they been done already?
In fact, no - the concept of an experiment as something very well defined in time is something for table-top apparatus. When we talk about an experiment at the scale of the LHC collider, we should rather convey the concept that once the apparatus is built, you start collecting data and you go on until you die - or nearly so. Because of the rarity of the processes you want to study, you need to collect as many data as possible, and so you keep running your experiment forever.
In my public lectures I often use the analogy of the deep underground cavern that a speleologist accesses for the first time: it is dark, and her flashlight only allows her to see to some distance in the chasm. By taking a long-exposure picture, she can see deeper. If she manages to expose the picture for still longer time, she will be able to discern more and more detail far in the distance inside the cavern: this is because the very little light that shines off the distant walls will have more of a chance of leaving trace in the picture. The same idea calls for long running of the accelerator experiments: the longer you collect data, the deeper you see - you get a chance to see tiny details that would otherwise be lost.
The tiny details are important because they give more precision to our tests of the current theory - the standard model of particle physics. We know that our theory, although wonderfully precise, is incomplete: there must be physical phenomena that violate it. Since we could not find any such phenomena with existing and previous experiments, we need to push our sensitivity and look deeper in the chasm.
So, LHC Run 1 (2010-2012) and Run 2 (2015-2018) collected lots of proton-proton collisions, but now we want to collect twice as many data as before in Run 3, and at a slightly increased collision energy. Collision energy, in the analogy of the cavern, might be likened to the power of the illuminating light. It takes less time to see faint details if we illuminate with a more powerful lamp. It is difficult to raise collision energy above the already fantastic value of 13 TeV; Run 3 is pushing this to 13.6 TeV, which is a decent 5% increase that corresponds to bumping up the probability of very rare phenomena by up to a factor of two, for those involving the production of very massive particles.
Pot-pourri of ATLAS results
So, without further ado, let me flash below some of the results I found most interesting from Bill Murray's talk. This being a selection of a selection, it is of course not representative of the large amount of great science that the experiment has been producing; it is only what I find interesting, from my biased and narrow perspective.
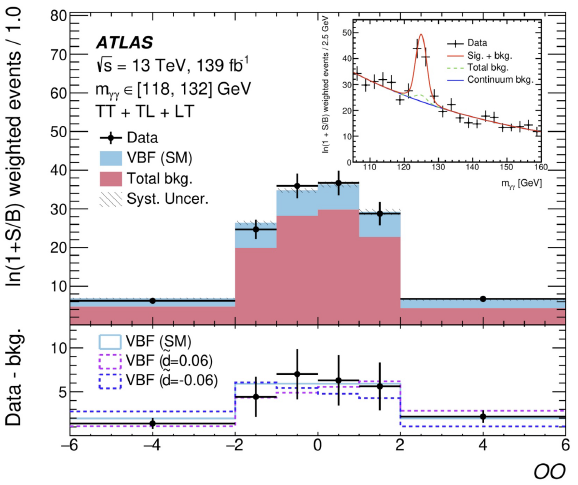
The first result is just a very neat bump in a mass distribution - the Higgs boson, in this case seen decaying into a pair of photons when there are accompanying signatures of forward jets, which betray that the production of the Higgs went by the process called "vector-boson fusion". In other words, what happened is that the colliding quarks in the protons both emitted a W or Z boson, and it is those (virtual) particles that annihilated into a Higgs boson. What is seen by the experiment is then the decay of the Higgs, along with a signal of the two quarks that originally emitted the vector bosons.
I am showing the graph because it shows a very clear peak, evidencing that this channel is the one with the largest signal to noise ratio. What you see in the distribution is a Gaussian-smeared line at 125 GeV (the Higgs boson mass) on top of a smoothly falling background at all mass values. The reason for this is that we are asking the following question to data that display two energetic photons: "If you two guys came from the decay of a particle, what would its mass be?". That question is answered by taking the energy and direction of the photons and computing with them their "invariant mass".

In the graph, the mass distribution is in the upper right inset; the data in the peak is used by ATLAS to extract information on some detailed properties of the Higgs boson through a related observable ("OO", for optimal observable), shown in the main graph, where the blue contribution is from real Higgs decays and red is from backgrounds in the mass region between 118 and 132 GeV.
The second result I want to flash below is a search for the production of a top quark pair in association with an energetic photon. What is the interest of searching for this process? One could in fact argue that since we know the LHC is producing top quark pairs, and since we know top quarks are electrically charged, then it goes without saying that we must expect some of those top quarks to give off a photon every now and then - this is what *all* electrically charged particles do.
The interest lays in the fact that when you study very rare processes you may bump into other, until then unseen, physical reactions that your theory did not predict. In addition, the presence of top quarks in the final state could single out new forces of nature that preferentially couple to those particles. So a comparison of the sheer rate of these events to standard model predictions can be the way to become sensitive to these possible new processes.
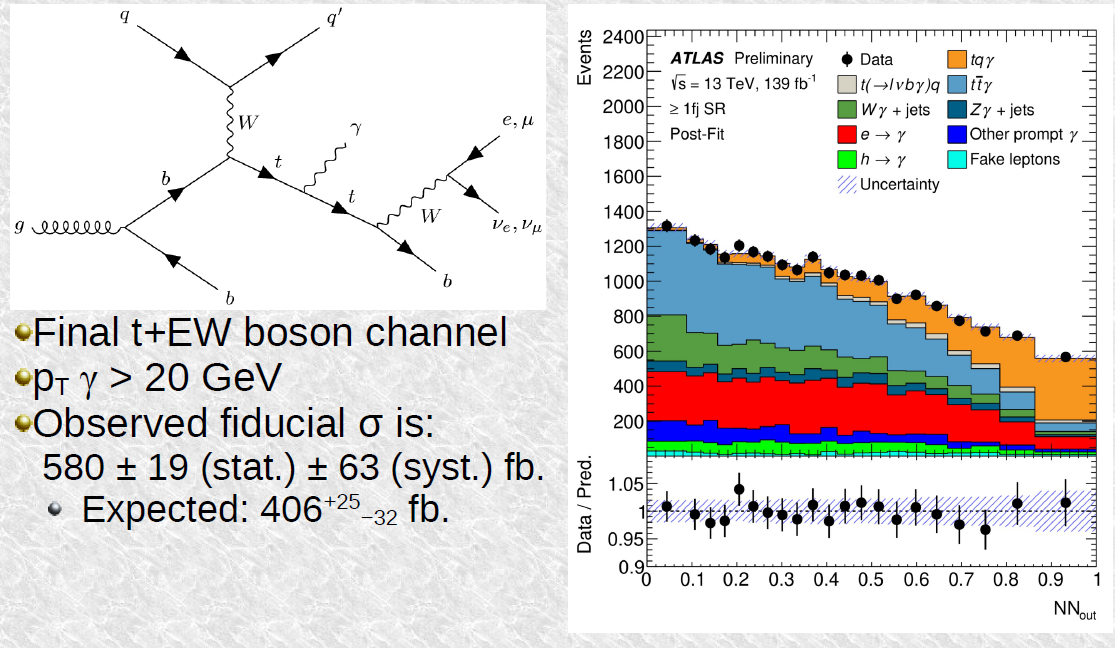
The picture below is Murray's slide on the search. On the top left you can see the Feynman diagram showing how a photon can be emitted by a top quark leg, before the top decays into the observed final state bodies. On the right you can see the distribution of a neural network output, when the network was trained to separate as well as possible the signal (in orange) from all competing backgrounds. ATLAS can then measure a cross section of 580 femtobarns for the process, which means that such a reaction takes place roughly six times every trillion collisions. This is a larger rate than predicted (406 femtobarns), but the uncertainty places this effect at the level of compatibility of a few percent - in other words, there is room for some new physics process in the data, but there is no real evidence for it, as in particle physics we require a much more stringent level of evidence to believe that we discovered something new.

The last result I will show below is the one concerning the search for rare Higgs boson decays. This is a topic of interest to me because a long time ago I searched for the associated production of a vector boson and a Upsilon meson, using CDF data. The Higgs boson had not been discovered yet, and there were some new physics ideas according to which that combination of final state particles could well be the result of the decay of a Supersymmetric Higgs. In my search I did not observe the process and only set an upper limit on it.
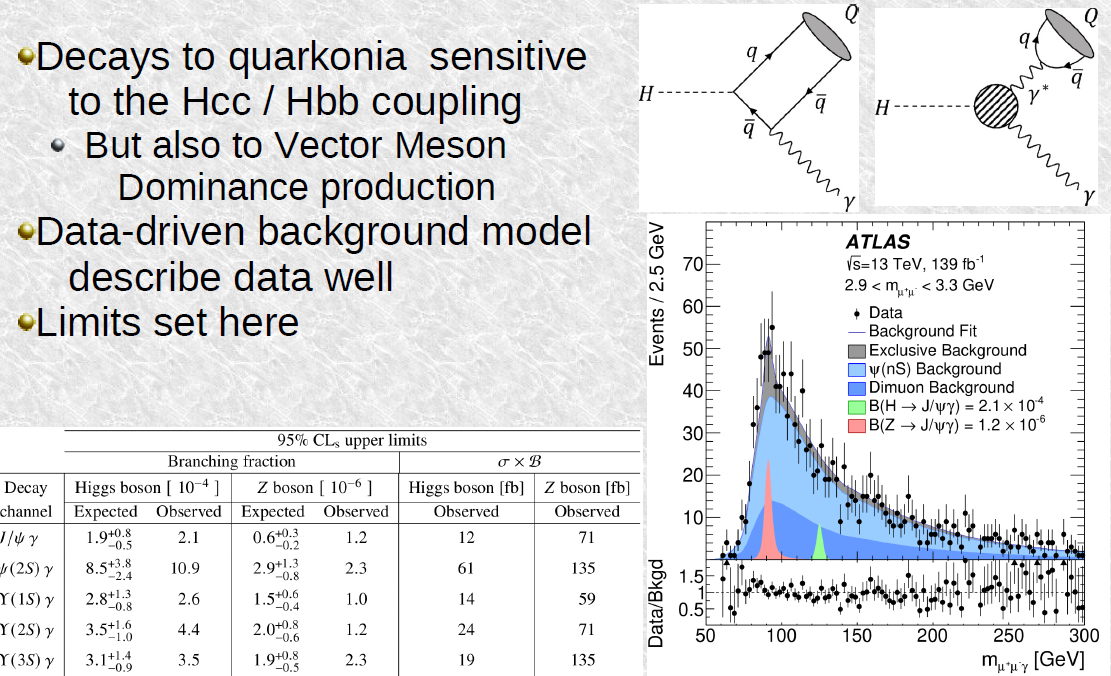
Here, ATLAS searches for a related process - a photon and a J/Psi meson, or a photon and a Upsilon meson. Since we now know what the mass of the Higgs is, we can go directly for a mass peak in the combined mass of the observed final state particles. This is shown in the bottom left graph, where the peaks that would be expected if the signal were present are shown in colour. No signal is seen though, so ATLAS can only set upper limits on the searched process (see table on the bottom left).

If you want to access the full set of results shown in the presentation, please visit the web site of the conference.


Comments