

One of the strongest results that Astronomy can produce is an image, a picture of a distant natural event we would never otherwise know about. Gravitational wave astronomy, however, focuses on just detecting gravitational waves. Each detector, which must be large, detects the equivalent of one pixel of gravitational wave. With two detectors we can verify that we have detected the waves and triangulate direction, with three or more we can do this better and better. Currently LIGO can and does produce images which show the probable location of the event that causes the gravitational waves on the sky. However, what I am writing about today is visualization of the gravitational waves themselves. I think about these things as a participant in the LISA fundamental physics working group.
What follows are just some ideas I have been working with on how to visualize solutions to the field equations I have been working on. The model has a working name of Starobinsky Scalar gravity. An observationally viable modification of general relativity that combines Starobinsky inflation with a very low mass scalar field dark matter candidate. Solving for the gravitational wave in the case of a very small object orbiting a very massive object (think a neutron star orbiting a super massive black hole). I found the following waveform.
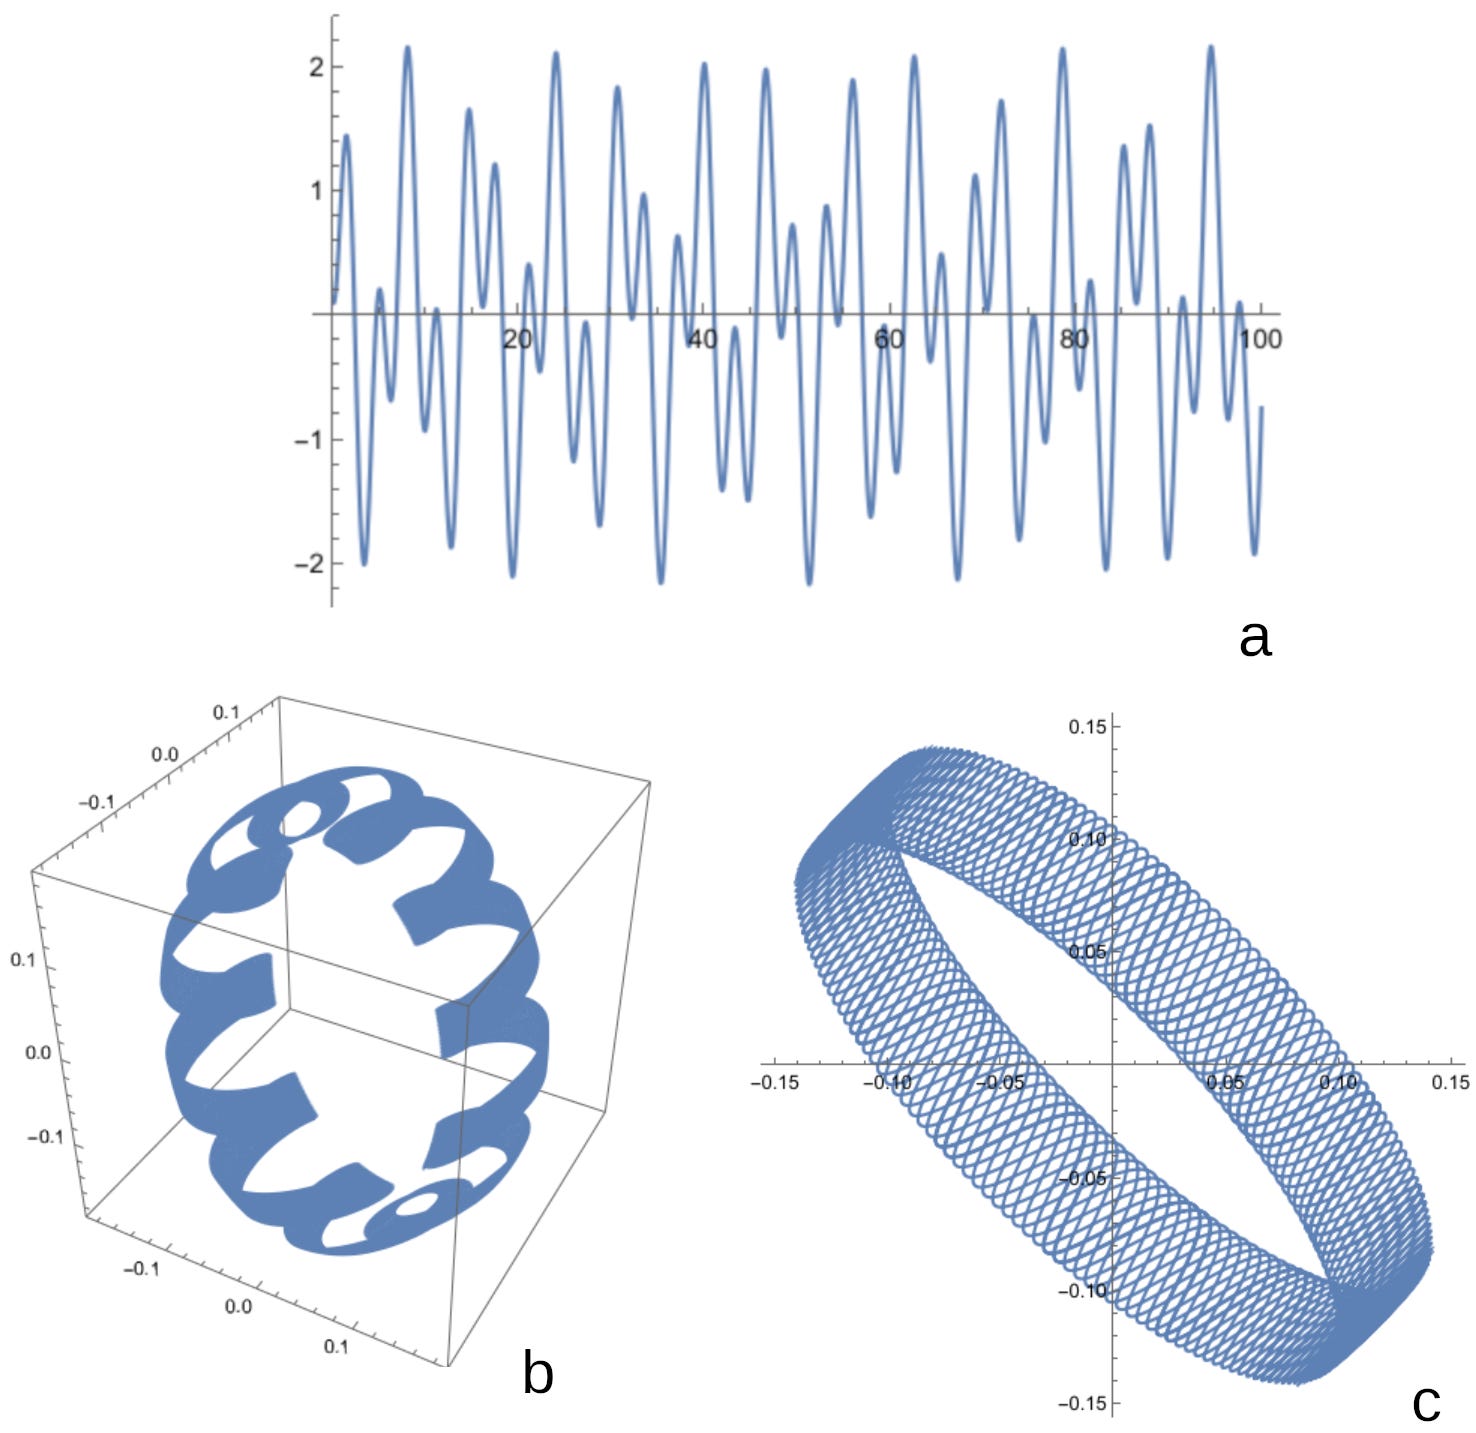 Figure 1a is the usual plot of the time dependence of the gravitational wave. b is a 3d parametric plot of the same wave, and b is a 2d plot of the same wave. This In each case a phase shift has been applied to the wave. This is an attempt at a simple “back of the envelope” attempt at understanding how combining different detectors with different sensitivities and distinctive features might work.
Figure 1a is the usual plot of the time dependence of the gravitational wave. b is a 3d parametric plot of the same wave, and b is a 2d plot of the same wave. This In each case a phase shift has been applied to the wave. This is an attempt at a simple “back of the envelope” attempt at understanding how combining different detectors with different sensitivities and distinctive features might work.
There are visualizations other than waves which are used by LIGO and VIRGO already. Lets look at these to see if what I’d have in mind would be crazy. They already use many creative ways of visualizing gravitational waves and related phenomena.
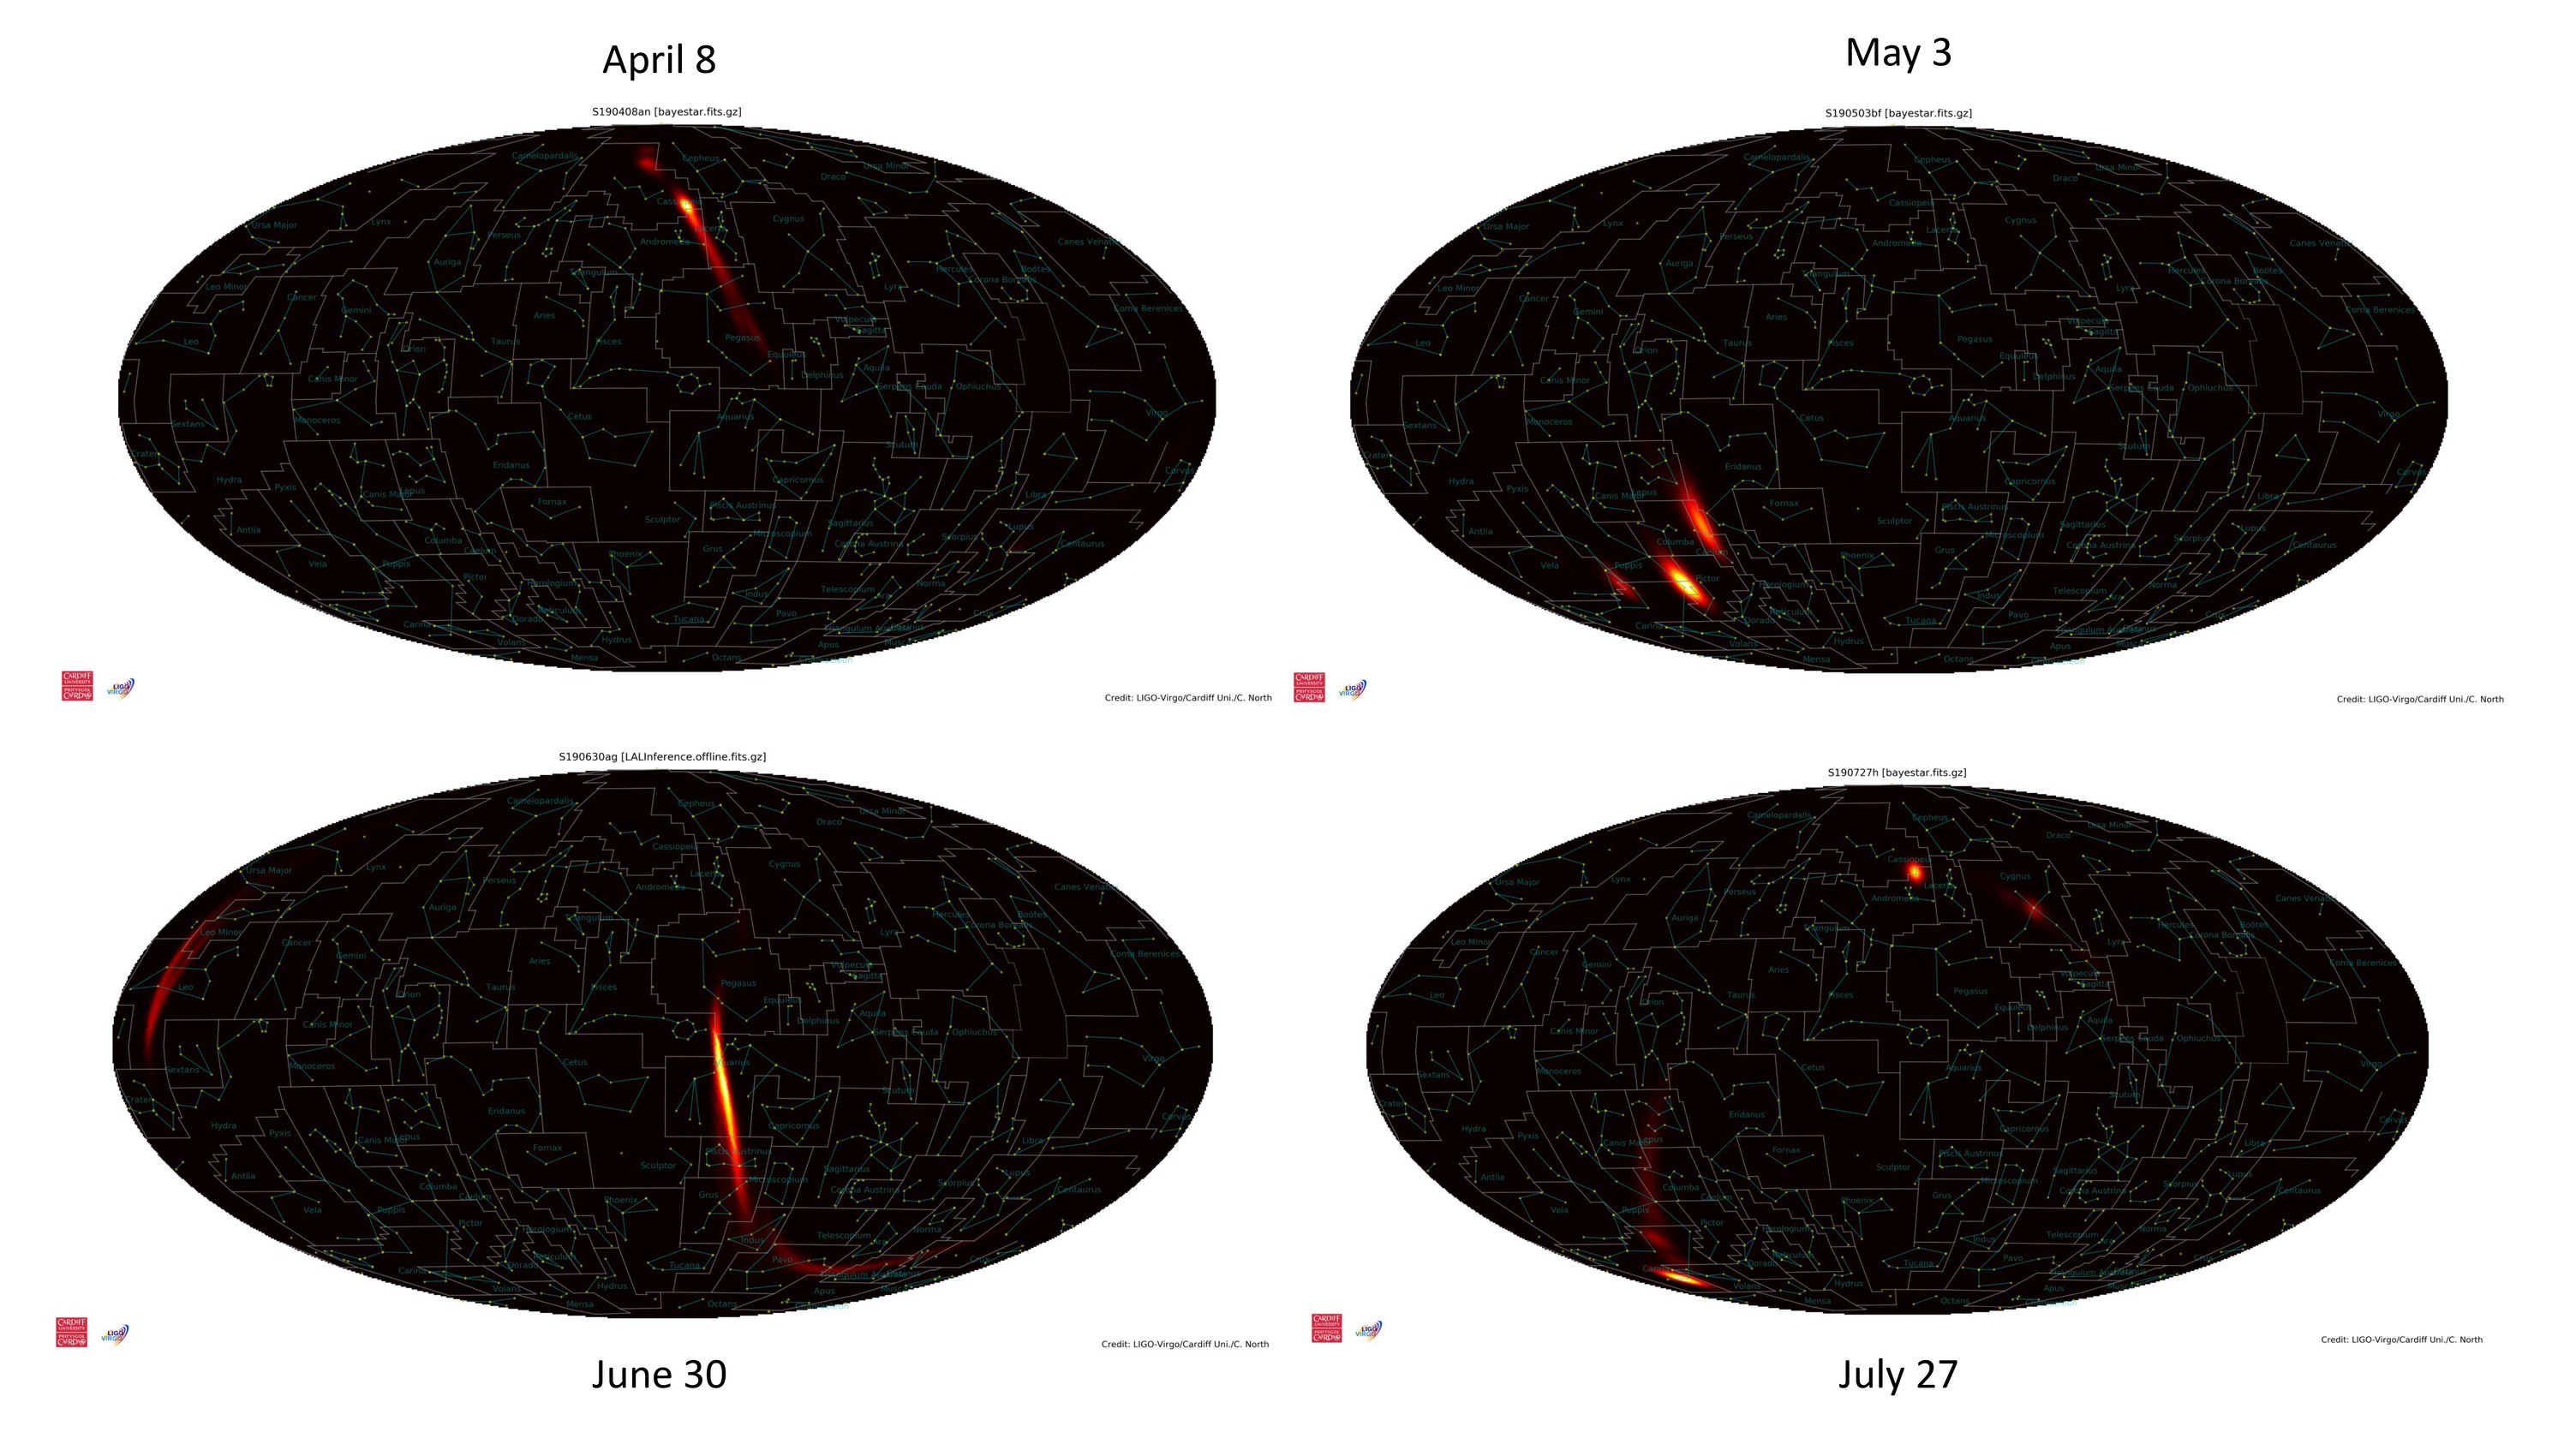 This image is credited to the LIGO collaboration I claim fair use. This is a typical image they produce but it does not show the waves but the possible location of the phenomenon which created the waves. These are great too.
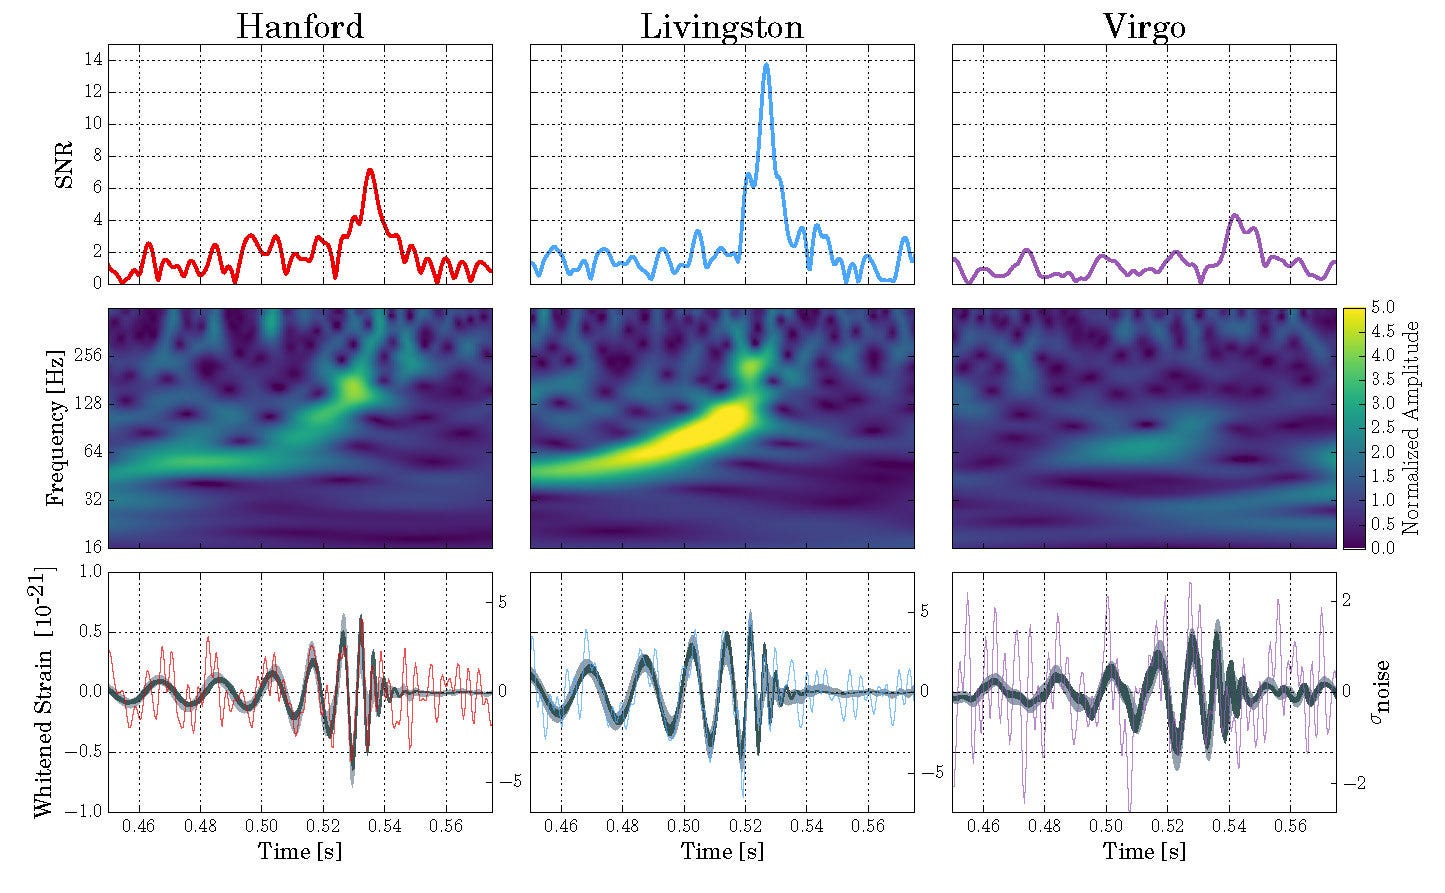 This image is credited to the LIGO VIRGO collaboration I claim fair use. The top line gives the signal to noise ratio (SNR) the middle the frequency shift over time, and the bottom is the waveforms for these chirps.
The question I wanted to address was what we would get if we treated each wave form as shown on the third line of the third figure as a parameter in a 2D or 3D space. What would that look like. My first figure gives a model of how that would look.
Mathematica Details For The Curious.
The action of the model I have been working with is given by the following.
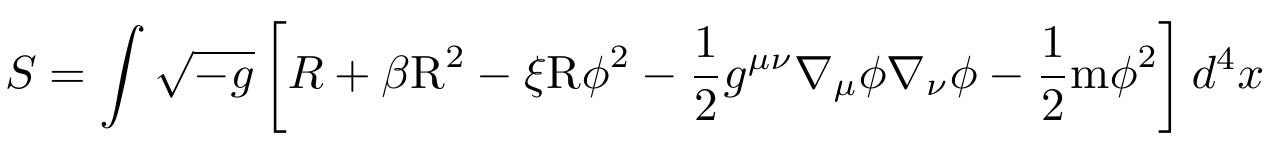
β is a parameter between zero and one. ξ is a parameter between zero minimal coupling and 1/6 conformal coupling. R is the Ricci scalar of space time curvature, and φ is a scalar field with a tiny mass m.
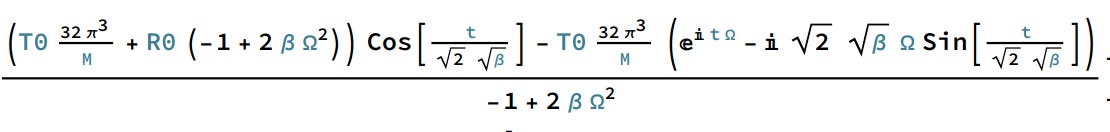
Deriving and solving the equations for R assuming that φ is small, then φ squared is ignorable in solving the field equations. This results with the assumption of circular orbits in an exact solution of simple form for the time dependence of R.
Then the plot at the top was made using Mathematica. Here is an example of a Mathematica manipulate with the time coordinate shifted by alpha and gamma. Perhaps once we have space based gravitational wave detectors varying these parameters will be viable and allow us to observe gravitational waves for different features.
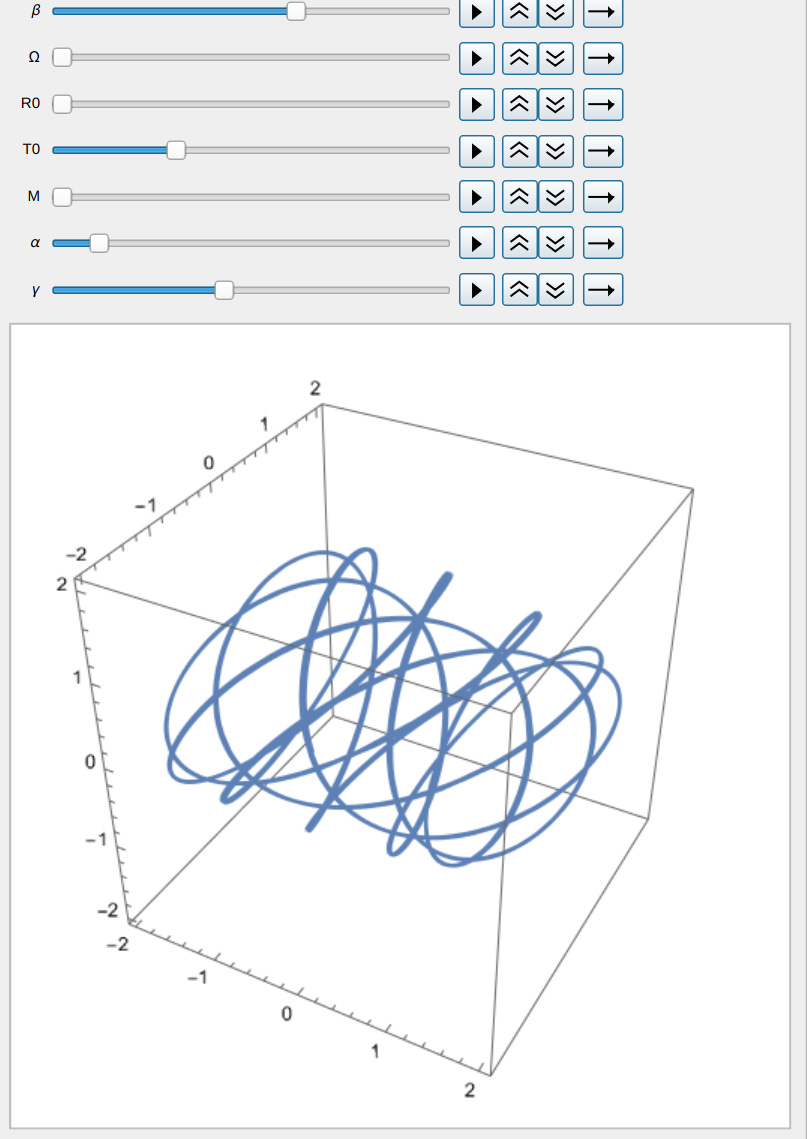 Here is an interactive form of the above figures I created. Try playing with the values and see what you find.
Who knows what we might learn about gravitational waves by looking at them from as many different directions as possible? What patterns might be visible, what mysteries uncovered?
If you enjoyed this article, please check out the articles by the other scientist here at science 2.0 and for early access to articles of mine subscribe to my Substack.

Comments