


Some satellites carry instruments that provide a global view of the surface temperature of oceans and seas. Satellite and local readings show that sea-surface temperature rose rapidly during the 1970s and '80s but then significantly slowed in the last 15 years.
Climate scientists have been scrambling to explain it and think they have an answer; rearrangement in the energy flow of the climate system and how the ocean stores heat. Scientists have speculated that one of the causes of this ‘plateau’ in sea-surface temperature could be a change in the exchange of ocean water between warm, surface waters and cold, deep waters below 700 m – as if the warming is ‘hiding’ underwater. Temperature measurements at this depth cover a relatively short period.
But the warm water won’t hide below the surface forever: scientists believe that it may re-emerge later or affect other climate indicators, such as sea level or ocean circulation.
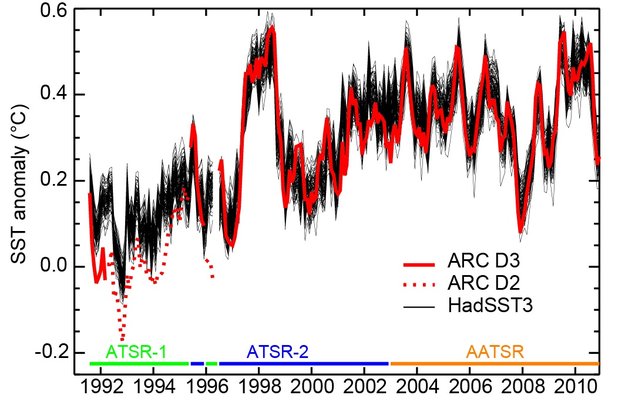
Global monthly mean sea-surface temperature (SST) anomalies relative to a 1961–90 climatology from satellites (ATSRs: Along-Track Scanning Radiometers) and in-situ records (HadSST3). Black lines: the 100-member HadSST3 ensemble. Red lines: ATSR-based night-time subsurface temperature at 0.2 m depth (SST0.2m) estimates from the ATSR Reprocessing for Climate (ARC) project. Retrievals based on three spectral channels (D3, solid line) are more accurate than retrievals based on only two (D2, dotted line). Contributions of the three different ATSR missions to the curve shown are indicated at the bottom. The in-situ and satellite records were collocated within 5×5° monthly grid boxes: only those where both datasets had data for the same month were used in the comparison. (Adapted from Merchant et al. 2012.) Credit: Hartmann, D.L., A.M.G. Klein Tank, M. Rusticucci, L.V. Alexander, S. Brönnimann, Y. Charabi, F.J. Dentener, E.J. Dlugokencky, D.R. Easterling, A. Kaplan, B.J. Soden, P.W. Thorne, M. Wild&P.M. Zhai, 2013: Observations: Atmosphere and Surface. In: Climate Change 2013: The Physical Science Basis. Contribution of Working Group I to the Fifth Assessment Report of the Intergovernmental Panel on Climate Change
ESA began monitoring sea-surface temperature in 1991 with the first Along-Track Scanning Radiometer on the ERS-1 satellite, followed by instruments on ERS-2 and Envisat.
ESA’s Climate Change Initiative, or CCI, responds to the need for continuous data on the energy budget in our climate system to understand better the slowing increase in sea-surface temperature. Satellite readings enable the detection of real trends in climate.
Sea-surface temperature in the Mediterranean Sea from January 2011 to May 2012 as measured by multiple Earth-observation missions. Credit: ESA / Medspiration
“We can observe changes in sea-surface temperature from the 19th century onwards using millions of measurements gathered by voluntary observers at sea and by buoys that drift around the oceans,” said Nick Rayner from the Met Office Hadley Centre in the UK. “CCI is developing sea-surface temperature information from satellites that provides an independent assessment of these changes over the last few decades.”
Project leader Chris Merchant, says, “When comparing changes in global average sea-surface temperature from these two sources, we see they provide a consistent picture since 1996, when the most reliable satellite measurements began. We are now working on applying our methods to earlier satellites, in order to extend reliable satellite-based information back into the 1980s.”
Rayner adds, “That will allow us to combine, with increased confidence, the sea-surface temperature information from satellites with measurements gathered in the ocean, to build a better, more complete picture of past changes.”


Comments