

The long-distance competition between CERN and Fermilab - between Europe and the US, if you like - for supremacy in the field of fundamental physics is made of direct challenges, like the search for the Higgs boson, as much as of indirect skirmishes, such as one facility excluding a signal that the other facility has a chance of discovering.
A picture-perfect example of the latter is the new search for Z' bosons that the CDF experiment has recently published. As soon as ATLAS and CMS will collect enough data, discovering Z' bosons will be their business, because of their 3.5 times higher center-of-mass energy. But at the present time CDF has data aplenty, while the CERN experiments at the LHC are still waiting for enough of it to gain the necessary sensitivity to put CDF (and D0) out of this business.
Now, you can easily imagine how an analyzer of LHC data who has spent the last few years of his or her life to set up a search for Z' bosons must feel, by seeing that the minimum mass where the signal may be meaningfully sought is moving out faster than data is arriving in his or her hands! If things go as predicted, LHC will deliver to CMS and ATLAS in the course of the next few months enough data to allow them to discover Z' bosons with masses way above the currently excluded region; but in the meantime, it is CDF who has the stage.
The CDF Search
The CDF search is based on a 4.6 inverse-femtobarn dataset of proton-antiproton collisions, collected since 2002 at the Tevatron collider. This huge dataset (which corresponds to 400,000 billion collisions!) has been sifted for events containing two high-energy muons of opposite charge. A Z' particle produced in the collision of a quark-antiquark pair should in fact decay to muon pairs if it exists (unless it is leptophobic, but let us leave this detail aside for the moment), and the signature should be quite easy to discern from backgrounds.
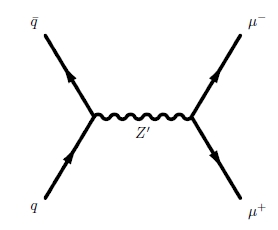
The figure on the right sketches the production and decay of a Z'. For those of you unfamiliar with Feynman diagrams, this figure should be "read" from the left to the right, since time is understood to run in that direction on the horizontal axis. The two lines coming together identify a quark from the proton and an antiquark of the same flavour from the antiproton. The vertical dimension symbolizes the spatial separation between the two particles, such that when the two lines join the two quarks find themselves in the same space-time point: they can then annihilate, turning their energy into mass and energy of the Z' boson. The latter then lives for a very short time, and then emits two muons (the segments on the right) in opposite directions.
By computing the invariant mass of the two muons in the selected events, CDF produces the histogram shown below. With the help of Monte Carlo simulations of all the conceivable physical processes that may give rise to the observed signature, the distribution of the data (black triangles with error bars) is understood quite well as being mostly the result of production and decay of off-shell Z bosons. Z bosons have a nominal mass of 91 GeV, but the probability to observe one such particle with a different mass is not zero: it is governed by a distribution function called "Breit-Wigner", which has long tails extending to infinity. In the figure the Z contribution is shown in grey.
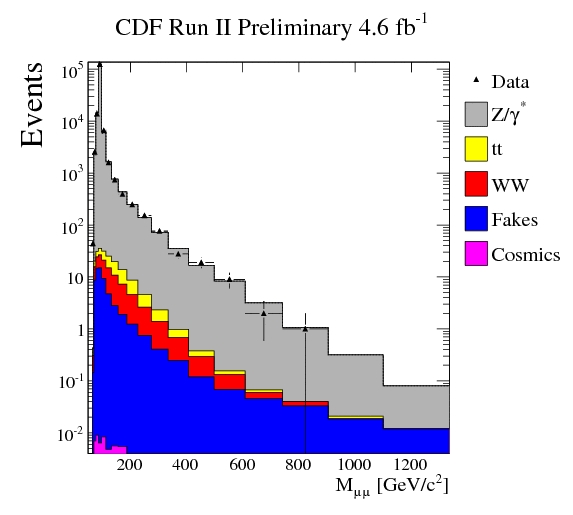
Other sizable background processes displayed in the figure, and which need to be properly accounted to understand in detail the mass spectrum, include the simultaneous production of two W bosons: when both W bosons decay into a muon-neutrino pair you get the same signature as the Z' signal. W boson pairs can either be produced directly (the red histogram) or from the decay of a top-antitop pair (in yellow).
The remaining backgrounds are contributed by fake muons (hadrons that are by mistake reconstructed as muons in the detector, in blue), and cosmic rays crossing the CDF detector through its center exactly when the proton collision takes place (in purple).
In the large dataset analyzed by CDF the highest-mass candidate dimuon event has a mass of 882 GeV: an exceptional event, but perfectly in line with the expectations. You can see a graphic display of the event below. The top panel shows a transverse view of the CDF detector, with the two muons emerging as unbent tracks from the center of the detector, and then leaving signals in the outer muon chambers (the boxes surrounding the central tracker).
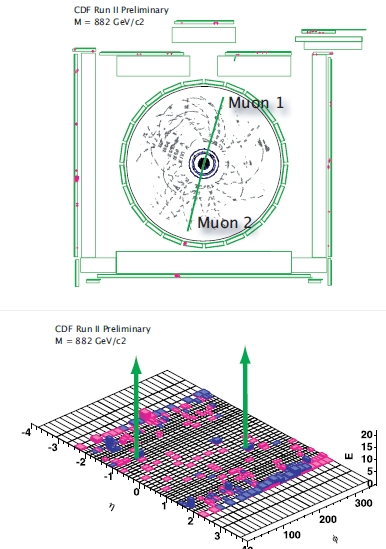
In the second panel above you see the CDF calorimeter system cut along the beam direction and "unrolled", as you would do to a cylinder to lay it flat. Each calorimeter tower is shown as a box, and the height of the box is proportional to the energy that the tower has recorded. The muons do not correspond to high energy deposits: they are minimum-ionizing particles. Also note that there is basically no other energetic object in this event apart from the two muons: their production occurs through an electroweak interaction, which does not produce large amounts of extra radiation.
Results
The mass spectrum is used to extract limits on the existence of Z' bosons. The authors have chosen to display the limit in terms of the fraction of signal events contained in the dataset: given the known physics contributions, this still allows to compare the limit to what would be expected if a Z' boson contributed to the data (blue curve in the graph below).
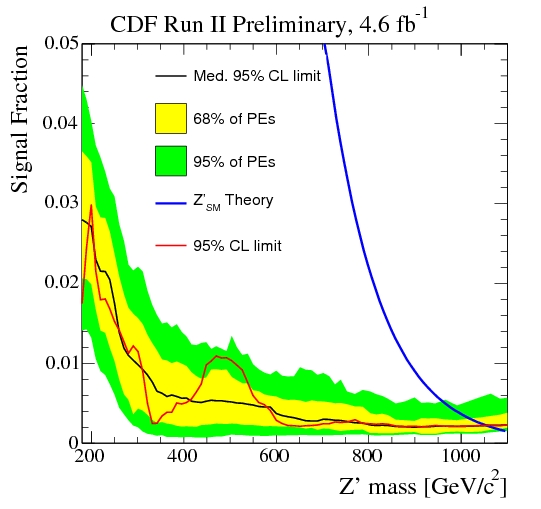
The red curve is the 95% confidence-level upper limit on the fraction of events that may be contributed by a Z' signal, as a function of Z' mass. The limit bounces up and down as a result of the observation of fewer of more events than expected backgrounds in each mass point. The curve still remains well within the expected green and yellow bands, which "bracket" the probable values that the limit that the search should obtain given the analysis method and the size of the data.
On the right, the point where the limit curve crosses the blue curve (the signal fraction expected if a Z' existed) corresponds to the lower limit on the Z' mass. Z' bosons with masses below that value (1071 GeV) would have left a detectable number of dimuon decays in the analyzed data; Z' bosons above that value would be undetectable and would not have changed appreciably the observed spectrum.
It is necessary for me to point out that different models of new physics that predict the existence of Z' bosons yield different predictions for the rate of production of those particles. CDF did set limits for each of those models. If you are interested about such details, you will find answers in the public page of the analysis.
Finally, I am happy to be able to explicitly thank the authors of this important new analysis by name: the CDF rules allow main authors to be sorted out from the over 600 signatories of the publication! My congratulations then go to D. Whiteson, K. Cranmer, E. Quinlan, A. Kotval, C. Hays, and O. Stelzer-Chilton.


Comments