

From the state's Market Squid Fishery Management Plan, which is available in its entirety here, comes a nice map showing the concentration of squid landings in the two primary fishing grounds: Monterey Bay and the Southern California Bight:
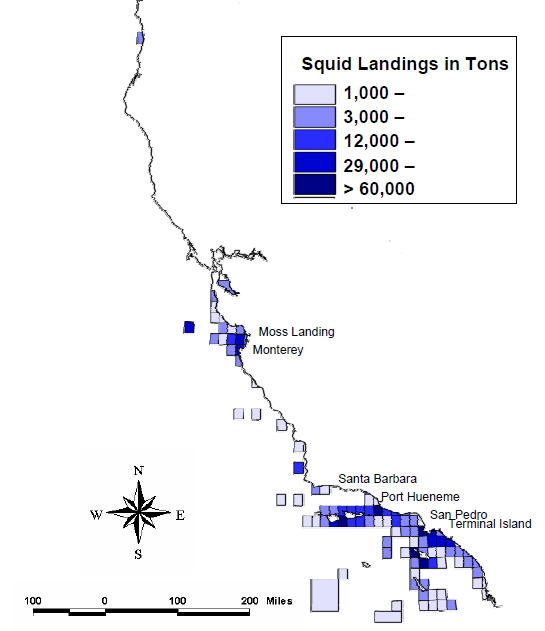
Catches from these two areas (and indeed, from the entire state) are pooled to determine when the harvest limit is reached. As for the limit itself, I wrote in the Weekly article:
The harvest limit was adopted in 2004 as the average of the three highest catch years on record. Years with low catches were excluded, Sweetnam explains, because during those years squid are thought to be naturally unavailable to the fishery, staying in deep water.The nice thing about having a blog is you can include as many supplementary figures as you like. Here's a table from the Fishery Management Plan showing all the possible harvest limits that they considered:
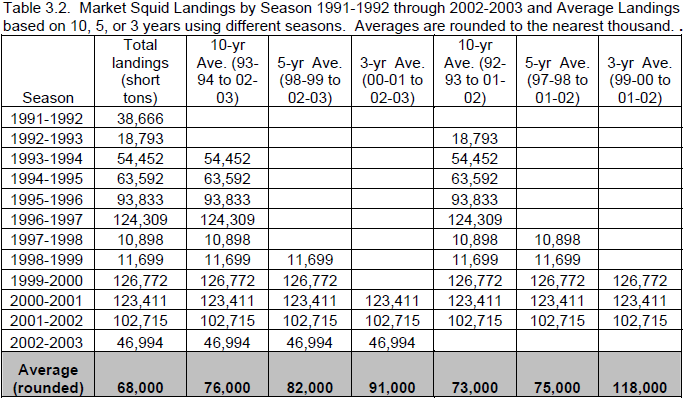
The actual harvest limit chosen is, of course, the one on the far right: 118,000 tons.


Comments