However, I do mean to stimulate the readers' (but hopefully, also the whole High-Energy Physics community's) critical thinking here - so, calling a "fluke" the new LHCb measurement of a departure from unity of a parameter (R_K) that should be exactly 1.0 in the Standard Model, at the 3.1 standard deviations level, is part of the game stipulation. For despite the tantalizing possibility of it being the first real door that opens up to beyond the Standard Model physics, the odds that this is instead only a fluke are really, really high.
Forty-second summary of what this is about
The LHCb experiment is one of the four main experiments instrumenting the Large Hadron Collider (LHC), CERN's powerful proton synchrotron. Among other things, LHCb looks for rare decays of particles made up by a bottom quark and another antiquark, called "B hadrons", and in this particular study compares the rate of decays of B hadrons to a kaon plus a muon pair to decays of B hadrons to a kaon plus an electron-positron pair. This ratio should be equal to one, but it turns out to be different from that. The "3.1 sigma" is a concise way to report how different the measurement is from the expectation of the Standard Model, the theory of subnuclear particles that physicists have cooked up in the late sixties of the past century and which continues to provide a nearly-perfect description of all observations, in spite of being considered in need of an extension which might give explanation to some unnatural numerical coincidences.
Ok, summary mode off. Now, the facts are in the news, and I will not comment on them too much here: the measurement reported by LHCb of the ratio of relative rates of a rare decay of B hadrons seems to imply a violation of a thing called "lepton universality" of the weak charged current, which you have to buy with the Standard Model package, and which implies that W bosons mediate weak interactions in the same way, irrespective of the kind of lepton pairs they couple to.
Due to the assumption of universality of charged-current weak interactions, a W boson will decay with almost exactly equal odds to electron-neutrino, muon-neutrino, and tauon-neutrino pairs. The "almost" is due to the fact that the decay rate depends not only on the coupling strength of the W to the leptons but also, albeit very slightly given the relative masses involved, on the mass of the decay products.
The observation of an apparent preference of W bosons to couple to one kind of leptons rather than another would be possible if we seriously hacked the Standard Model's internal laws, or more practically if we added to the Standard Model a new force that allows processes to take place similarly to what the weak force does. A new heavy boson would e.g. allow hadrons to exhibit a different pattern of decay rates. This indirect, "low-energy" way of becoming sensitive, and maybe discovering, heavy new particles is very appealing, as a way to probe high-mass mediators is offered by high-statistics studies such as those that LHCb has been designed to perform, rather than brute-force very energetic collisions, which as we know are limited by our technology and our research funds.
A significant effect. So what does it mean?
The LHCb measurement of an apparently different rate of decays of B hadrons to electron and muon final states thus calls for our undivided attention, and if you ask me, I am all for strenghtening that investigation effort in all possible ways - in fact, I am personally involved in a search in CMS data for the rare decay of the B_s meson into tau lepton pairs, something we will not see with LHC Run 2 data but which may become measurable with the larger datasets that the forthcoming LHC Run 3 is promising to deliver. In fact, the presence of a violation of lepton universality would most likely involve an increased rate of decays of the B_s into third generation leptons, so the latter search is relevant to this area of physics investigation.
But on the other hand, I feel the need to warn that everybody here must keep their feet on the floor. The measured effect is a 3.1 standard deviations one. Generally speaking, that is something that you should happen to observe by chance only once in a thousand cases.Were this a study in almost any other field of science, those 3.1 standard deviations would be very solid evidence of the discovery of some new effect, but not in particle physics.
Physicists have set to 5.0 sigma the threshold at which they allow themselves to call something a new discovery (a 5 sigma significance level correspond to a probability of a part in 3 millions), and they did this for a good reason. The reason was a protection against multiple hypothesis testing, something that was done a lot in the late sixties in searches for exotic hadrons. On the other hand, such a high discovery threshold protects a little bit also against systematic effects unaccounted for by experimentalist: the so-called "unknown unknowns", biases and smearings that may completely screw up the assessment of results.
The two usual suspects
Multiple hypothesis testing can be simply explained by a lottery analogy. If you buy a lottery ticket your odds of winning the first prize are one in 10 millions, maybe, because they printed 10 million tickets and sold them all. So every Jane knows that by purchasing more lottery tickets her chances will improve, right? Indeed, the more tickets she holds in her hand, the higher her odds of winning the prize consequently get. Multiple testing is the same thing: by searching for an anomaly in the data multiple times, you increase the odds that you see one "by chance", i.e. because the data fluctuated to give you that result, even if there is no anomaly.
Nowadays we have ways to correct for multiple testing, so we regularly quote "local" and "global" signal significances in our search papers. The local significance is a measure of how likely it is that you get a result at least as extreme as the one you got, if there is no anomaly in the data - i.e., if the null hypothesis is correct. The global significance is the same thing, but it accounts for the fact that you tested the hypothesis multiple times, as if you purchased multiple lottery tickets.
So, we (almost) have control over our multiple hypothesis testing of the Standard Model. There are papers with 2000 citations out there which explain how to turn a local into a global significance, for example. On the other hand, nobody has yet come up with a sound way to deal with the possible existence of ill-modeled or unknown systematic effects, and nobody will: these things will be with us forever. Therefore, the high value of our "discovery threshold" of 5 sigma will not protect from the odd loose cable, or other accidentals.
[To those of you who did not get it, I refer to a loose cable above because in 2011 the OPERA experiment declared that neutrinos were superluminal based on a measurement - at 6.0 sigma level - which was affected by a loose cable causing a 60 nanoseconds delay in an electronic signal. You can start reading the story here.]
All the above is well known and in the bones of the experimentalists who do particle searches at the LHC and elsewhere. But still, I see too much excitement around, so I need to mention something else. Let us change our perspective here, from frequentisms to Bayesianism, for just a minute (I belong to the frequentist school, but frequentists are allowed to use Bayes' theorem without changing flag, if they don't do it too frequently).
p-values and standard deviations
Let us start by considering the prior distribution of measurements we routinely perform, in the case that the Standard Model is correct and that we are not subject to unknown systematic effects. This can be visualized as a Gaussian distribution, centered at zero, and with unit sigma. Numbers sampled from that distribution represent the possible outcomes, in standard deviations from the expectation, of a measurement corresponding to the testing of a hypothesis - like, e.g., the verification that R_K is indeed 1.0 in the Standard Model.
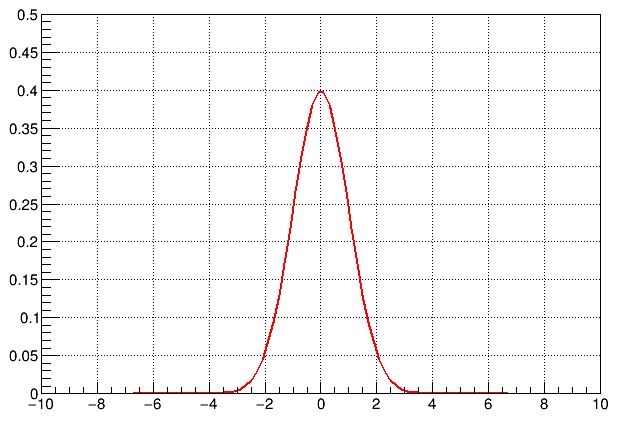
Note, pretty please: the distribution being Gaussian has absolutely no connection with any assumption on measurement errors being Gaussian, or anything of the kind. It is only a convention that we report small probabilities by converting them into a number of standard deviations from the mean of a Normal distribution ("Normal" is the more technical name of a unit-sigma Gaussian centered at zero).
What we do, in fact, is to cook up a test statistic from simulated data - a one-dimensional summary of our measurements - and predict what values that number is likely or not likely to take under the null hypothesis (e.g., that the Standard Model is true and there is no new physics in the data). Once we measure a value of that test statistic from real data, we compare it to the distribution, and if it falls in a region where the distribution is poorly populated we may convert that observation into a p-value, by e.g. integrating the distribution from the observed value to infinity, if we expect that new physics would have biased our number to be higher than what the Standard Model expects.
Once we get a p-value from that tail probability, we convert it into the corresponding standard deviations by saying: "such an extreme value of the test statistic corresponds to having measured a variable distributed according to a Normal at a value of N standard deviations". N is thus in a two-way mathematical relation with the p-value, and it is usually a small, manageable number - for example, 3-sigma (N=3) correspond to a p-value of 0.0017; or 5-sigma correspond to 0.000000297.
Odds ratio
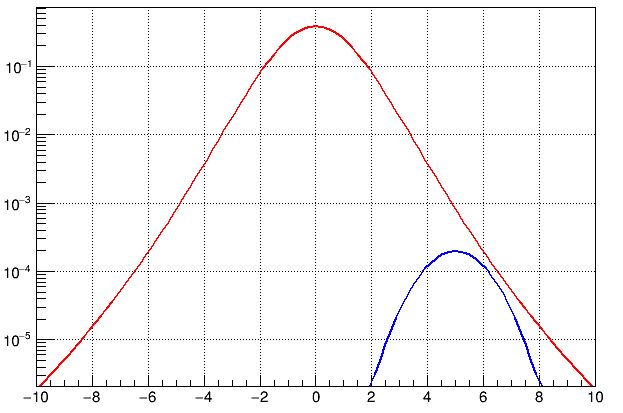
The Normal is our "prior" in case there is no new physics. Now, what would the prior be in case there were indeed new physics to discover? Here, the fact that the Standard Model has withstood decades of precise tests implies that any new physics hides in very low-rate phenomena. This is the curse of particle physics: we can access new phenomena by increasing the energy of our collisions and/or the amount of collected data, but whatever new phenomenon we will encounter will first show up as a very low significance thing, and only grow slowly with time as we improve our statistics and/or measurement precision. So particle physicists are doomed to endlessly fiddle with 2-sigma and 3-sigma effects - most of which will go away, and only in exceptional circumstances will grow big and discovery-like significances. Also, the new physics phenomena we may chance to have access to are rare by definition. So the situation may look like the one in the graph below.
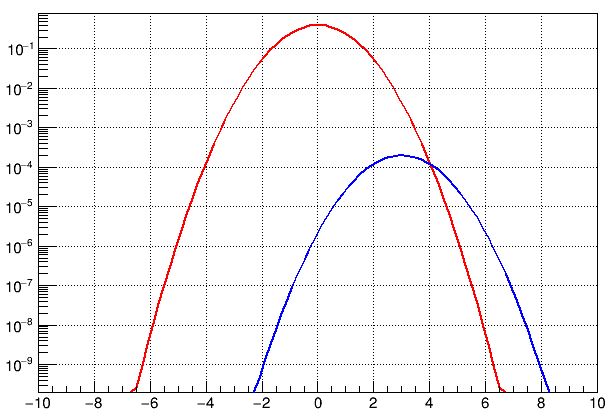
The red "null hypothesis" Gaussian now looks like a parabola, because I have turned the vertical axis into a logarithmic one. I did it because otherwise you would not have had a chance to see the blue distribution, which has a normalization of 1/2000th of the red one. Why did I choose 2000? Well, because that is the order of magnitude of the number of scientific publications published by the LHC in this kind of new physics searches. You could have chosen a different number, but its size is not the main point here. The blue curve represents the range of values of significance one might observe if new physics were contaminating the data, in one measurement sensitive to it. Shift it up or down by a factor of two and my argument remains valid.
Observe how the probability that a "significant" effect - one that is 3 sigma away from zero, and thus at the value x=3 of the x axis - belongs to the class brought by fluctuations (the red curve) is still much higher than the probability that it is brought about by a new physics phenomenon coming into light (the blue one). This is represented by the Normal distribution being higher, for x=3 sigma, than the density of the new physics distribution. Again, I stress that the latter has a very small normalization because it represent that one measurement which could betray new physics, in a sea of thousands of measurements we may perform with LHCb (or any other experiments') data.
[Another thing to observe is that new physics _could_ in this case have generated a very significant, 6- or 7-sigma effect (you can see it by following the blue curve to corresponding values of the abscissa), but that would have been an improbable outcome of the measurement: in the case described by the curves above, even for the case of new physics in the data, a 3-sigma effect is all what the experimenters could hope for, on average.]
What this tells you is that the probability that a 3-sigma effect be indeed originated from new physics should be considered very small - and hence our enthusiasm should be kept under control. Of course you might argue that the distributions in the graph were chosen in a totally arbitrary way. Sure, they were just meant to illustrate the general situation: nobody would know how to normalize these curves one to the other, even if there were new physics of some kind to discover. The observation, however, remains: if you only consider the Standard Model curve, you are likely to say "it's very odd to observe such an effect". But if you consider the alternatives, you may be brought to revise your statement. Odd or not, we saw such an effect: hence all we can do, in a Bayesian sense, is to compare the posterior odds of the possible causes.
One thing that is certainly true, of course, is that by accumulating more data the situation of LHCb might become rosier: the Gaussian distribution expected from Standard Model-only would stay where it is (as its shape is universal, for a well-modeled experiment), while the new physics distribution would move to larger expected significances, because of the higher precision of the new situation.
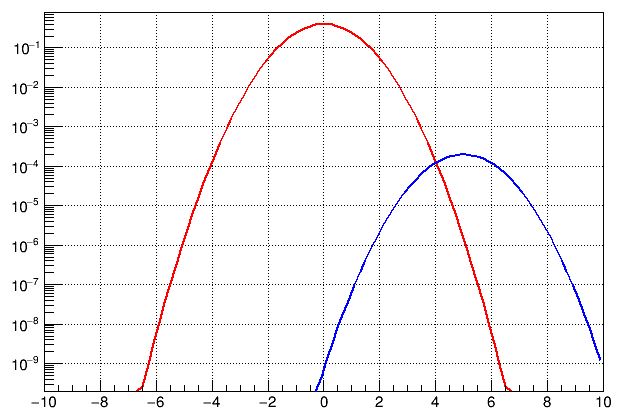
That situation is shown in this other graph above. By moving away from zero, the odds ratio between the alternative and the null hypothesis would increase and eventually turn in favor of the former -when the blue curve goes above the red one. This, by the way, is the observation that was made by some commenters of the LHCb result: for the 3.1-sigma effect was previously a smaller significance effect, and by increasing their analyzed dataset the "odd" effect became more odd instead of being reabsorbed as fluctuations normally do.
Systematics at play
But here the other effect - unknown systematics - comes into play with a thunder. If your estimate of the significance is produced by underestimating, or ignoring, even a subtle and small systematic effect, your estimate will be biased high. Now, the more data you collect, the more this bias will stick up as a sore thumb, and look increasingly like a new physics effect. But it isn't: it is only due to our incapability of modeling our experimental conditions to infinite precision.
You may think of a systematic effect as something that is capable of shifting the entire red curve to the right, because of a bias in the measurement procedure. In that case, the significance of the data will grow indefinitely even without new physics, as collecting more data would correspond to shifting the curve more and more to the right. However, it is more disciplined to consider systematics as effects that make your residual distribution different from a Normal, as this is what they will eventually look like when you consider collectively a pool of many different measurements. Let me explain what I mean by citing an important work on this topic.
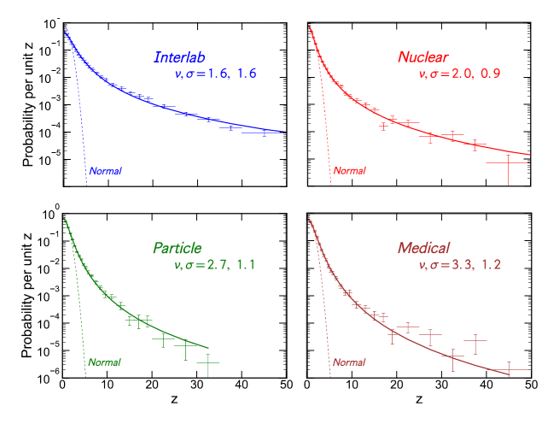
A 2016 paper by a David Bailey exemplified how the residuals - in numbers of sigma - of our measurements, as well as measurements done in totally different domains, are invariably affected by this pathology. Our distribution of residuals, in number of sigmas, for the null hypothesis are **NOT** Gaussians, despite our efforts to make them such. Note, our residuals should be perfect Gaussians irrespective of the measurement we are performing, for here we are not discussing how the distribution function from which we sample our observable quantities are shaped, but the "pure quantity" of standard deviations, which we attempt to construct such that it behaves like a Gaussian.
What we do is to carry out statistical inference on a parameter which we assume belongs to some (whatever it is) distribution; we have called it a test statistic above. From an observation that the test statistic we find is "extreme" (i.e., that it lays on the tail of the expected distribution) we extract a p-value as a tail probability. We then convert the latter number into a number of sigma using a mathematical map, which allows us to speak of significances in sigma units rather than with clumsy strings of zeroes tralining small numbers.
Now, if the p-value itself is badly calculated, because the distribution function that our test statistic should have under the null hypothesis is not the one we expect, the residuals will then not distribute as a Normal. That is precisely what the graph below shows: what should be Normal distributions (the dotted distributions, which again in semi-log graphs show up as parabolas) is not Normal in fact (full curves, which behave more like Student distributions). And this, demonstrated by looking at real measurements, shows that we cannot trust our Gaussian prior for the null hypothesis that much... Please look at how wide the true residual distributions are, in experimental practice! Significances of 10, 20, 30 sigmas (the horror, the horror) are plentiful! And here we are considering measurements of quantities that _do_ obey the null hypothesis.
Now let us substitute the null hypothesis distribution in our simplified graphs with a Student 10 distribution (which was shown even before Bayleys' work to be a better representation of residuals in particle physics measurements, in a paper by Matts Ross and collaborators in 1975), and you immediately realize that even in the second situation, where the new physics graph is liable to produce more extreme standard deviations, the odds ratio goes back to be in favor of the null!
I hope this may convince you that yes, 3.1 sigma are an interesting observation, and that yes, LHCb is well advised to put even a stronger effort into examining this with more data and still better measurement methods; and yet at the same time, you should dampen your enthusiasm quite a bit.
In the end, the relevant question remains the one posed by de Finetti, through his famous operational definition of probability. Up to how many $$$ would you be willing to bet that the LHCb signal is due to new physics finally emerging from the data, if by winning you were promised $1000 in return? Would you be willing to, e.g., risk $10? Maybe I would. That would be giving the LHCb signal 1% odds of being real new physics. Would you bet $1000? Ok, you can do what you like with your money, but in my opinion you would be quite foolish to bet on this being new physics at even odds. Maybe after reading this article your maximum bet on the genuine new physics nature of the R_K measurement will decrease. In that case, I will not have wasted a nice and sunny Saturday morning typing on this keyboard.
[Incidentally, I once was on the right side of such a $1000 bet on new physics, at even payoffs, against Gordon Watts and Jacques Distler. The story of that bet is given in these three blog posts: this one, where I launch the challenge; this, where I summarize the results; and this guest post by Jacques where he declares defeat.]
---
Tommaso Dorigo (see his personal web page here) is an experimental particle physicist who works for the INFN and the University of Padova, and collaborates with the CMS experiment at the CERN LHC. He coordinates the MODE Collaboration, a group of physicists and computer scientists from eight institutions in Europe and the US who aim to enable end-to-end optimization of detector design with differentiable programming. Dorigo is an editor of the journals Reviews in Physics and Physics Open. In 2016 Dorigo published the book "Anomaly! Collider Physics and the Quest for New Phenomena at Fermilab", an insider view of the sociology of big particle physics experiments. You can get a copy of the book on Amazon, or contact him to get a free pdf copy if you have limited financial means.


Comments