

A significance Z of the observation of more events than predicted can then be computed by evaluating the probability that such a discrepant dataset be observed if the null hypothesis is indeed true, and then converting that probability into Z (the two are in a one-to-one relation, as I explain below). Note that we always talk of the probability of the data, not the probability of the hypothesis here! Please remember this, it is very important.
 To clarify the meaning of significance and its relation with the probability of the data, let us make a simple example. If I throw a die five times and I always get a six, this is a rather odd effect: I might have the temptation to believe that the die is loaded. So I define my "null hypothesis" as the one that the die is a honest one, which will on average yield a six one sixth of the times. I can then proceed to compute the probability that by throwing the die five times I get five sixes. Since each throw is independent on all others, this probability is of course equal to one sixth multiplied by itself five times, or (1/6)^5= 0.00012.
[Somebody might then notice that it is questionable that I attribute some special value to throw of the die resulting in the number six: they might argue that I would have been just as surprised if I had gotten five ones, or five threes in a row. This is the analogue of what particle physicists call the "look elsewhere effect". (If you are interested, the link brings you to one of my most successful blog articles). In this particular case the look-elsewhere effect could be accounted for by waiving the first throw (setting the initial value of the series), which corresponds to multiplying by six the probability of my odd observation. But let us leave this detail aside today.]
A statistician could be happy with the probability just computed (which they call "p-value") and consider it the end result of the investigation. Physicists, however, like to make one additional step, obtaining the significance from the p-value. The significance Z of a probability p=0.00012 can be obtained by finding the point of a Gaussian distribution centered at zero and of sigma equal to one such that the integral from Z to infinity of the curve is equal to p, as shown in the figure below (where a value Z=2.2 has been picked, corresponding to a p-value of about 2%).
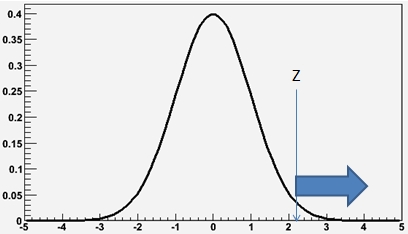 In other words, we model our "null hypothesis" with a Gaussian probability density function: the area of any slice of the Gaussian curve between two points [x1,x2] then corresponds to the probability that, the null hypothesis being true, one observes a value x in that interval. The probability of getting a sequence at least as odd as the one we did get can then be visualized as the area under the right tail of the curve; the point Z defining the start of this "tail slice" is then a useful measure of this oddity.
Note that this Z value has no more information than the original p-value; the two are in fact one the function of the other. Nevertheless, physicists use Z values to report their odd results: they say that their data shows "evidence" of a phenomenon if the data has a significance above 3 with respect to the null hypothesis. They talk of "observation" of a phenomenon if the Z-value is above five. These are what you have heard around called as "three-sigma" and "five-sigma", in fact. That is because the Gaussian we have taken as our model of the probability density function of the null hypothesis has a parameter, sigma, which is our unit of measurement of Z.
One should note here that in the example we made we were not concerned with any alternative hypothesis in constructing our Z value: the significance of the data with respect to a well-specified null hypothesis (in our case, the honesty of the die) can always be computed if we can define a coherent p-value. Yet an "alternate hypothesis" can usually also be specified, of course: it could in our case be the fact that the die is loaded, such that e.g. the number "6" has a probability of 50% of occurring; a different alternate hypothesis could be that both "6" and "4" have each a 40% chance of occurring (as opposed to 16.6%, i.e. one sixth each). If we marry one particular alternate hypothesis, we can build a significance value which not only addresses how rare is the observation of a departure from the null, but speaks of how more likely is the alternative we hypothesized. That can be done with a "relative likelihood" approach, which is discussed below.
A Physics Example - The New LHCb Observation
Besides the absence of an "alternate hypothesis", in the above construction we have only considered statistical effects: we have taken the die throw as a perfectly random process, not affected by the way we throw it or other possible peculiarities of the experimental conditions under which we have collected our data. This is fine for a die throw - dice were indeed designed such that the randomness of their result be quite insensitive on external factors. In physics measurements, however, there are always sizable systematic effects at work. These effects have the potential to make a statistically rare observation more likely. We cannot easily explore the effect of systematic uncertainties with the die example, so we need to turn to real physics if we want to discuss them.
So let us take a measurement of branching fractions of B meson decays to pion-pion and kaon-pion pairs obtained by the LHCb collaboration, and published in this paper. They precisely measure several interesting branching fractions, but they also notably observe one of these for the first time: this is the decay of the B_s meson into pion pairs.
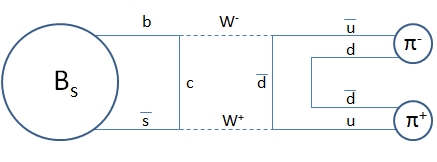 [A digression: the decay B_s -> pi pi is a rare process, and that is why it had not been detected before. The B_s meson is a particle containing a bottom quark and a strange quark, and the bottom usually decays yielding a charm quark, while in order for the B_s to turn into pions the bottom must convert into a up quark (pions only contain up and down quarks). One diagram showing how this happens is shown on the right: weak interactions with a charged current -i.e., the emission of a W boson- are the only physical means of changing the flavour of a quark. Since both the b and the s quark in the B_s need to turn into lighter quarks, the process is quite rare.]
Let us go back to statistics now. What allows LHCb to say they have "observed" this decay mode is the fact that they may quote a significance larger than five sigma, Z>5, for the signal observed. The test, as explained above, is a test of the null hypothesis versus the alternate hypothesis that a signal of B_s decay to pion pairs is present, with a strength larger than zero.
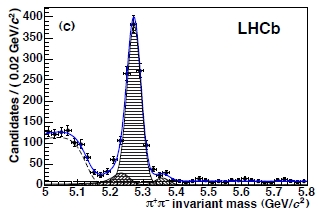 What is done in practice is to fit the mass distribution of pion pairs in the data (see figure on the left, where data are points, blue curve the fit, and the various components are shown with different hatching) to the null hypothesis alone, expressed by a likelihood function L_B which only knows the background processes assumed to be present in the data: these are all particle reactions which yield pairs of opposite-charge pion candidates with a combined invariant mass in the whereabouts of the B_s mass value. [Note I am speaking of "pion candidates": LHCb performs a particle identification of the charged tracks they observe, but there is some chance that what is interpreted as a pion is in reality another particle (most likely a kaon)].
Another digression: What's a Likelihood Function ?
Let me stop for a second, since I am sure that if there are any readers left at this point deep down this piece, they deserve to not be left alone if they don't known what a likelihood function is.
A likelihood function is a function of a set of parameters given some observed data. In general it can be constructed as the product of probability density functions describing the probability that the parameters take on certain possible values given the particular set of data which was observed.
[In the die example above, we could have written the likelihood as a function of the probability that the die comes up with a six up, call it "p". If you take N to be the number of throws, and N6 the number of times that a six is obtained, this is just L(p)=(1/p)^N6*[1/(1-p)]^(N-N6). In this simple example it is easy to see that L is maximum when p is such that it best matches the number of throws, i.e. when p=N6/N.]
For the case at hand, the likelihood of the background hypothesis alone is the product over all observed mass values in the data of sums of different mass distributions; the relative normalization of these components are free parameters. Finding the maximum of the likelihood function as a function of these parameters allows the shape of the combined mass distribution to best match what is observed in the data.
A second fit instead interprets the data according to the alternate hypothesis. This is expressed by a likelihood L_BS which contains, in addition to the background parameters, a "signal strength" parameter, left free in the fit; this multiplies the mass distribution which is expected for B_s decays (a Gaussian shape, centered on the mass of the B_s meson). The maximum of the likelihood L_BS allows one to extract the signal strength, in the hypothesis that the signal is indeed present in the data.
Fitting a meaningful signal strength (i.e. one which is significantly different from zero) is not granted, until we have proven that the B_s -> pi pi signal is indeed contributing to the data in an observable way. Crucially, a theorem due to S. Wilks (the link brings you to the original 1938 paper) guarantees that, under certain regularity conditions, the difference in the log-likelihood values of L_BS and L_B at the maximum distributes in a known way (to be precise, the square root of -2 times that difference distributes as a chi-square distribution for one degree of freedom). This if the added parameter which distinguishes the alternate hypothesis BS from the null hypothesis B is not needed -i.e, if the null hypothesis is true.
So, thanks to Wilks' theorem, the likelihood-ratio test is rather standard practice: we take the value of the log-likelihood ratio, multiply it by minus two, take the square root, and compare this "test statistics" with the chisquared distribution. We then integrate the chisquare curve from the observed value to infinity, and get a p-value of the data under the null hypothesis. Finally we may convert that p-value into a regular Z value by using the Gaussian curve as explained above. Confused ? Well, you have all rights to be. But fortunately, you need not remember all these mathematical details to follow the rest of this post.
Indeed, the above procedure is what the LHCb collaboration did to get their statistical significance. They extracted a value Z=5.5 from the procedure, which is a significance exceeding the magical threshold of "five sigma": they have the right to claim they observed the rare B_s decay to pion pairs.
Systematic uncertainties, the heart of the matter
However, there is the problem of systematic uncertainties. Systematic uncertainties may affect the likelihood distributions of background-only (null) and signal plus background (alternate) hypotheses, and so these "nuisance parameters" (another statistics-derived jargon: nuisance parameters are ones describing the effect of the systematics) must be taken into account before one can draw any conclusions from a p-value extracted as discussed above from statistical procedures that are oblivious of these effects.
In general, a systematic effect might tweak the shapes of mass distributions of the background, causing the likelihood L_B and L_BS to change as well, and consequently affecting the distribution of the likelihood ratio test statistics. Unfortunately, it is often hard to know precisely the size of these effects. One may only hypothesize their presence, and make best-guess estimates of their entity. To treat correctly the effect of systematics in a significance calculation one must then incorporate them into the definition of the likelihood function: they become additional parameters in the formula.
There are standard techniques that allow one to "sample" the possible values of these systematic parameters, calculating the effect on the likelihood ratio. All this is a sort of black magic for all but a restricted number of colleagues, so do not expect that the next particle physicist you meet on the road can explain them to you. It would not be time well-spent for you anyways: unless you really need to do these calculations yourself, it is just important to understand that incorporating the effect of systematic uncertainties in a significance calculation is not a trivial matter.
The way LHCb appears to be incorporating systematic effects in their significance calculation is different, and I might define it a shortcut. I must warn the reader that I am not sure that I interpret correctly the relevant paragraph of text where they explain their calculation, but what I gathered was that they reasoned as follows.
Systematic uncertainties of course increase the total error. Standard practice used e.g. when one is interested in comparing different measurements of the same quantity is to use as total error of an estimat the square root of the sum of squared statistical and systematic uncertainty (errors add in quadrature if they behave as Gaussian distributions, in fact). So LHCb takes their statistical significance Z=5.5 -which is a number of sigmas, and thus a number which scales with the uncertainty of the measurement in principle- and rescales it by the ratio between the statistical error on the yield of B_s decays to pion pairs found in their fits and the total error, the latter computed as just discussed. A clip of the article is shown below.
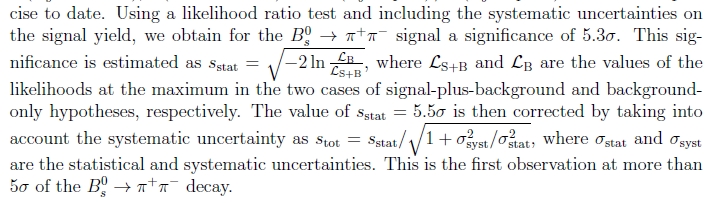
The result of the calculation is that the significance Z goes down to 5.3 sigma. Still above five standard deviations: the B_s meson is happily still in observation-level territory. I personally think their data indeed constitutes an observation of the rare decay, but I would have been happier to see a proper calculation of the significance for this important signal. In any case, due congratulations to LHCb for their new measurement !


Comments