


Let me set the stage.
By Christopher Monckton of Brenchley
As Anthony and others have pointed out,even the New York Times has at last been constrained to admit what Dr. Pachauri of the IPCC was constrained to admit some months ago. There has been no global warming statistically distinguishable from zero for getting on for two decades.
The NYT says the absence of warming arises because skeptics cherry-pick 1998, the year of the Great el Niño, as their starting point. However, as Anthony explained yesterday, the stasis goes back farther than that. He says we shall soon be approaching Dr. Ben Santer’s 17-year test:if there is no warming for 17 years, the models are wrong.
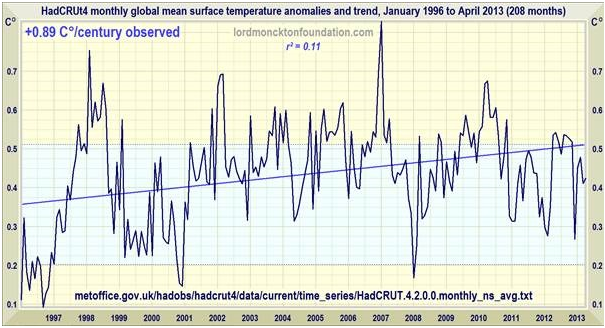
Usefully, the latest version of the Hadley Centre/Climatic Research Unit monthly global mean surface temperature anomaly series provides not only the anomalies themselves but also the 2 σ uncertainties.
Superimposing the temperature curve and its least-squares linear-regression trend on the statistical insignificance region bounded by the means of the trends on these published uncertainties since January 1996 demonstrates that there has been no statistically-significant warming in 17 years 4 months:
rgb at duke says:
Saying that we need to wait for a certain interval in order to conclude that “the models are wrong” is dangerous and incorrect for two reasons. First — and this is a point that is stunningly ignored — there are a lot of different models out there, all supposedly built on top of physics,and yet no two of them give anywhere near the same results!
This is reflected in the graphs Monckton publishes above,

Here is the caption for this figure from the AR5 draft:
Estimated changes in the observed globally and annually averaged surface temperature (in °C) since 1990 compared with the range of projections from the previous IPCC assessments. Values are aligned to match the average observed value at 1990. Observed global annual temperature change,relative to 1961–1990, is shown as black squares (NASA (updated from Hansen et al., 2010; data available at http://data.giss.nasa.gov/gistemp/); NOAA (updated from Smith et al., 2008; dataavailable at http://www.ncdc.noaa.gov/cmb-faq/anomalies.html#grid); and the UK Hadley Centre (Morice et al., 2012; data available at http://www.metoffice.gov.uk/hadobs/hadcrut4/) reanalysis).
Whiskers indicate the 90% uncertainty range of the Morice et al. (2012) data set from measurement and sampling, bias and coverage (see Appendix for methods). The colored shading shows the projected range of global annual mean near surface temperature change from 1990 to 2015 for models used in FAR (Scenario D and business-as-usual), SAR(IS92c/1.5 and IS92e/4.5), TAR (full range of TAR Figure 9.13(b) based on the GFDL_R15_a and DOE PCM parameter settings), and AR4 (A1B and A1T). The 90%uncertainty estimate due to observational uncertainty and internal variability based on the Had CRUT4 temperature data for 1951-1980 is depicted by the grey shading. Moreover, the publication years of the assessment reports and the scenario design are shown.
rgbatduke says:
where the AR5 trend line is the average over all of these models and in spite of the number of contributors the variance of the models is huge.
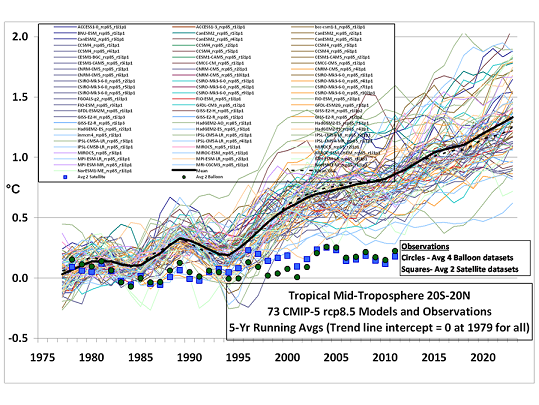
It is also clearly evident if one publishes a “spaghetti graph” of the individual model projections (as Roy Spencer recently did in another thread) — it looks like the frayed end of a rope, not like a coherent spread around some physics supported result.
Note the implicit swindle in this graph — by forming a mean and standard deviation over model projections and then using the mean as a “most likely” projection and the variance as representative of the range of the error, one is treating the differences between the models as if they are uncorrelated random variates causing >deviation around a true mean!.
Say what?
This is such a horrendous abuse of statistics that it is difficult to know how to begin to address it. One simply wishes to bitch-slap whoever it was that assembled the graph and ensure that they never work or publish in the field of science or statistics ever again.One cannot generate an ensemble of independent and identically distributed models that have different code. One might, possibly, generate a single model that generates an ensemble of predictions by using uniform deviates (random numbers) to seed “noise” (representing uncertainty) in the inputs.
What I’m trying to say is that the variance and mean of the “ensemble” of models is completely meaningless,statistically because the inputs do not possess the most basic properties required for a meaningful interpretation. They are not independent, their differences are not based on a random distribution of errors, there is no reason whatsoever to believe that the errors or differences are unbiased (given that the only way humans can generate unbiased anything is through the use of e.g. dice or other objectively random instruments).
So why buy into this nonsense by doing linear fits to a function — global temperature — that has never in its entire history been linear, although of course it has always been approximately smooth so one can always do a Taylor series expansion in some sufficiently small interval and get a linear term that — by the nature of Taylor series fits to nonlinear functions — is guaranteed to fail if extrapolated as higher order nonlinear terms kick in and ultimately dominate? Why even pay lip service to the notion that or for a linear fit, or for a Kolmogorov-Smirnov comparison of the real temperature record and the extrapolated model prediction, has some meaning? It has none.
Let me repeat this. It has no meaning! It is indefensible within the theory and practice of statistical analysis. You might as well use a ouija board as the basis of claims about the future climate history as the ensemble average of different computational physical models that do not differ by truly random variations and are subject to all sorts of omitted variable, selected variable,implementation, and initialization bias. The board might give you the right answer, might not, but good luck justifying the answer it gives on some sort of rational basis.
Let’s invert this process and actually apply statistical analysis to the distribution of model results Re:the claim that they all correctly implement well-known physics. For example, if I attempt to do an apriori computation of the quantum structure of, say, a carbon atom, I might begin by solving a single electron model, treating the electron-electron interaction using the probability distribution from the single electron model to generate a spherically symmetric“density” of electrons around the nucleus, and then performing a self-consistent field theory iteration (resolving the single electron model for the new potential) until it converges. (This is known as the Hartree approximation.)
Somebody else could say “Wait, this ignore the Pauli exclusion principle” and the requirement that the electron wave function be fully antisymmetric. One could then make the (still single electron) model more complicated and construct a Slater determinant to use as a fully antisymmetric representation of the electron wave functions, generate the density, perform the self-consistent field computation to convergence. (This is Hartree-Fock.)
A third party could then note that this still underestimates what is called the “correlation energy” of the system, because treating the electron cloud as a continuous distribution through when electrons move ignores the fact that individual electrons strongly repel and hence do not like to get near one another. Both of the former approaches underestimate the size of the electron hole, and hence they make the atom “too small” and “too tightly bound”. A variety of schema are proposed to overcome this problem — using a semi-empirical local density functional being probably the most successful.
A fourth party might then observe that the Universe is really relativistic, and that by ignoring relativity theory and doing a classical computation we introduce an error into all of the above (although it might be included in the semi-empirical LDF approach heuristically).
In the end, one might well have an“ensemble” of models, all of which are based on physics. In fact, the differences are also based on physics — the physics omitted from one try to another,or the means used to approximate and try to include physics we cannot include in a first-principles computation (note how I sneaked a semi-empirical note in with the LDF, although one can derive some density functionals from first principles (e.g. Thomas-Fermi approximation),they usually don’t do particularly well because they aren’t valid across the full range of densities observed in actual atoms). Note well, doing the precise computation is not an option. We cannot solve the many body atomic state problem in quantum theory exactly any more than we can solve the many body problem exactly in classical theory or the set of open, nonlinear, coupled,damped, driven chaotic Navier-Stokes equations in a non-inertial reference frame that represent the climate system.
Note well that solving for the exact, fully correlated nonlinear many electron wave function of the humble carbon atom — or the far more complex Uranium atom — is trivially simple(in computational terms) compared to the climate problem. We can’t compute either one, but we can come a damn sight closer to consistently approximating the solution to the former compared to the latter.
So, should we take the mean of the ensemble of “physics based” models for the quantum electronic structure of atomic carbon and treat it as the best prediction of carbon’s quantum structure? Only if we are very stupid or insane or want to sell something. If you read what I said carefully (and you may not have — eyes tend to glaze over when one reviews a year or so of graduate quantum theory applied to electronics in a few paragraphs, even though I left out perturbation theory, Feynman diagrams, and ever so much more :-) you will note that I cheated — I run in a semi-empirical method.
Which of these is going to be the winner? LDF, of course. Why? Because the parameters are adjusted to give the best fit to the actual empirical spectrum of Carbon. All of the others are going to underestimate the correlation hole, and their errors will be systematically deviant from the correct spectrum. Their mean will be systematically deviant, and by weighting Hartree (the dumbest reasonable “physics based approach”) the same as LDF in the “ensemble” average, you guarantee that the error in this “mean” will be significant.
Suppose one did not know (as, at onetime, we did not know) which of the models gave the best result. Suppose that nobody had actually measured the spectrum of Carbon, so its empirical quantum structure was unknown. Would the ensemble mean be reasonable then? Of course not. I presented the models in the way physics itself predicts improvement — adding back details that ought to be important that are omitted in Hartree. One cannot be certain that adding back these details will actually improve things, by the way, because it is always possible that the corrections are not monotonic (and eventually, at higher orders in perturbation theory, they most certainly are not!) Still, nobody would pretend that the average of a theory with an improved theory is “likely” to be better than the improved theory itself, because that would make no sense. Nor would anyone claim that diagrammatic perturbation theory results (for which there is a clear apriori derived justification) are necessarily going to beat semi-heuristic methods like LDF because in fact they often do not.
What one would do in the real world is measure the spectrum of Carbon, compare it to the predictions of the models, and then hand out the ribbons to the winners! Not the other way around. And since none of the winners is going to be exact — indeed,for decades and decades of work, none of the winners was even particularly close to observed/measured spectra in spite of using supercomputers (admittedly,supercomputers that were slower than your cell phone is today) to do the computations — one would then return to the drawing board and code entry console to try to do better.
Can we apply this sort of thoughtful reasoning the spaghetti snarl of GCMs and their highly divergent results? You bet we can! First of all, we could stop pretending that “ensemble” mean and variance have any meaning whatsoever by not computing them. Why compute a number that has no meaning? Second, we could take the actual climate record from some “epoch starting point” — one that does not matter in the long run, and we’ll have to continue the comparison for the long run because in any short run from any starting point noise of a variety of sorts will obscure systematic errors — and we can just compare reality to the models.We can then sort out the models by putting (say) all but the top five or so into a “failed” bin and stop including them in any sort of analysis or policy decisioning whatsoever unless or until they start to actually agree with reality.
Then real scientists might contemplate sitting down with those five winners and meditate upon what makes them winners — what makes them come out the closest to reality — and see if they could figure out ways of making them work even better. For example, if they are egregiously high and diverging from the empirical data, one might consider adding previously omitted physics, semi-empirical or heuristic corrections, or adjusting input parameters to improve the fit.
Then comes the hard part. Waiting.The climate is not as simple as a Carbon atom. The latter’s spectrum never changes, it is a fixed target. The former is never the same. Either one’s dynamical model is never the same and mirrors the variation of reality or one has to conclude that the problem is unsolved and the implementation of the physics is wrong, however “well-known” that physics is. So one has to wait and see if one’s model, adjusted and improved to better fit the past up to the present, actually has any predictive value.
Worst of all, one cannot easily use statistics to determine when or if one’s predictions are failing, because damn, climate is nonlinear, non-Markovian, chaotic, and is apparently influenced in nontrivial ways by a world-sized bucket of competing,occasionally cancelling, poorly understood factors. Soot. Aerosols. GHGs.Clouds. Ice. Decadal oscillations. Defects spun off from the chaotic process that cause global, persistent changes in atmospheric circulation on a local basis (e.g. blocking highs that sit out on the Atlantic for half a year) that have a huge impact on annual or monthly temperatures and rainfall and so on.Orbital factors. Solar factors. Changes in the composition of the troposphere, the stratosphere, the thermosphere. Volcanoes. Land use changes. Algae blooms.
And somewhere, that damn butterfly. Somebody needs to squash the damn thing, because trying to ensemble average a small sample from a chaotic system is so stupid that I cannot begin to describe it. Everything works just fine as long as you average over an interval short enough that you are bound to a given attractor, oscillating away, things look predictable and then — damn, you change attractors. Everything changes!All the precious parameters you empirically tuned to balance out this and that for the old attractor suddenly require new values to work.
This is why it is actually wrong-headed to acquiesce in the notion that any sort of p-value or R squared derived from an AR5 mean has any meaning. It gives up the high ground (even though one is using it for a good purpose, trying to argue that this“ensemble” fails elementary statistical tests. But statistical testing is a shaky enough theory as it is, open to data dredging and horrendous error alike,and that’s when it really is governed by underlying IID processes (see“Green Jelly Beans Cause Acne”). One cannot naively apply a criterion like rejection if p < 0.05, and all that means under the best of circumstances is that the current observations are improbable given the null hypothesis at 19 to 1. People win and lose bets at this level all the time. One time in 20, in fact. We make a lot of bets!
So I would recommend — modestly —that skeptics try very hard not to buy into this and redirect all such discussions to questions such as why the models are in such terrible disagreement with each other, even when applied to identical toy problems that are far simpler than the actual Earth, and why we aren’t using empirical evidence (as it accumulates) to reject failing models and concentrate on the ones that come closest to working, while also not using the models that are obviously not working in any sort of “average”claim for future warming. Maybe they could hire themselves a Bayesian or two and get them to recompute the AR curves, I dunno.
It would take me, in my comparative ignorance, around five minutes to throw out all but the best 10% of the GCMs(which are still diverging from the empirical data, but arguably are well within the expected fluctuation range on the DATA side), sort the remainder into top-half models that should probably be kept around and possibly improved,and bottom half models whose continued use I would defund as a waste of time. That wouldn’t make them actually disappear, of course, only mothball them. If the future climate ever magically popped back up to agree with them,it is a matter of a few seconds to retrieve them from the archives and put them back into use.
Of course if one does this, the GCM predicted climate sensitivity plunges from the totally statistically fraudulent 2.5 C/century to a far more plausible and still possibly wrong ~1C/century, which — surprise — more or less continues the post-LIA warming trend with a small possible anthropogenic contribution. This large a change would bring out pitchforks and torches as people realize just how badly they’ve been used by a small group of scientists and politicians, how much they are the victims of indefensible abuse of statistics to average in the terrible with the merely poor as if they are all equally likely to be true with randomly distributed differences.
Rgb
rgbatduke says:
As I understand it, running the same model twice in a row with the same parameters won’t even produce the same results. But somehow averaging the results together is meaningful? Riiiight. As meaningful as a “global temperature” which is not at all.
This, actually, is what MIGHT be meaningful. If the models perfectly reasonably do “Monte Carlo Simulation” by adding random noise to their starting parameters and then generate an ensemble of answers, the average is indeed meaningful within the confines of the model, as is the variance of the individual runs. Also, unless the model internally generates this sort of random noise as part of its operation, it will indeed produce the same numbers from the same exact starting point (or else the computer it runs on is broken). Computer code is deterministic even if nature is not. This isn’t what I have a problem with. What I object to is a model that predicts a warming that fails at the 2-3 sigma level for its OWN sigma to predict the current temperatures outside still being taken seriously and averaged in to “cancel” models that actually agree at the 1 sigma level asif they are both somehow equally likely to be right.
The models that produce the least average warming in the whole collection that contributes to AR5 are the only ones that have a reasonable chance of being at least approximately correct. Ones that still predict a climate sensitivity from 3 to 5 C have no place even contributing to the discussion. This is the stuff that really has been falsified (IMO).
Also, global temperature is a meaningful measure that might well be expected to be related to both radiative energy balance and the enthalpy/internal energy content of the Earth. It is not a perfect measure by any means, as temperature distribution is highly inhomogeneous and variable, and it isn’t linearly connected with local internal energy because a lot of that is tied up in latent heat, and a lot more is constantly redistributing among degrees of freedom with vastly different heat capacities,e.g. air, land, ocean, water, ice, water vapor, vegetation.
This is the basis of the search for the “missing heat” — since temperatures aren’t rising but it is believed that the Earth is in a state of constant radiative imbalance, the heat has to be going somewhere where it doesn’t raise the temperature (much). Whether or not you believe in the imbalance (I’m neutral as I haven’t looked at how they supposedly measure it on anything like a continuous basis if they’ve ever actually measured it accurately enough to get out of the noise) the search itself basically reveals that Trenberth actually agrees with you. Global temperature is not a good metric of global warming because one cannot directly and linearly connect absorbed heat with surface temperature changes —it can disappear into the deep ocean for a century or ten, it can be absorbed by water at the surface of the ocean, be turned into latent heat of vaporization, be lost high in the troposphere via radiation above the bulk of the GHE blanket to produce clouds, and increase local albedo to where it reflects 100x as much heat as was involved in the evaporation in the first place before falling as cooler rain back into the ocean, it can go into tropical land surface temperature and be radiated away at enhanced rates from the in the SB equation, or it can be uniformly distributed in the atmosphere and carried north to make surface temperatures more uniform. Only this latter process — improved mixing of temperatures — is likely to be“significantly” net warming as far as global temperatures are concerned.
rgb
rgbatduke says:
@ rgb@duke. I took the liberty of sending an email to Judy Curry asking that she take a look at your comment and consider asking you to write a tightened up version to be used as a discussion topic at ClimateEtc. Please give this some thought and ping her at her home institution to the Southwest of you. (Okay, West Southwest.)
Thank you,
RayG
Sounds like work. Which is fine, but I’m actually up to my ears in work that I’m getting paid for at the moment. To do a “tightened up version” I would — properly speaking — need to read and understand the basic structure of each GCM as it is distinguished from all of the rest. This not because I think there is anything in what I wrote above that is incorrect, but because due diligence for an actual publication is different from due diligence for a blog post, especially when one is getting ready to call 40 or 50 GCMs crap and the rest merely not yet correct while not quite making it to the level of being crap. Also, since I’m a computational physicist and moderately expert in Bayesian reasoning, statistics, and hypothesis testing I’d very likely want to grab the sources for some of the GCMs and run them myself to get a feel for their range of individual variance (likely to increase their crap rating still further).
That’s not only not a blog post,that’s a full time research job for a couple of years, supported by a grant big enough to fund access to supercomputing resources adequate to do the study properly. Otherwise it is a meta-study (like the blog post above) and a pain in the ass to defend properly, e.g. to the point where it might get past referees.In climate science, anyway — it might actually make it past the referees of a stats journal with only a bit of tweaking as the fundamental point is beyond contention — the average and variance badly violate the axioms of statistics,hence they always call it a “projection” (a meaningless term) instead of a prediction predicated upon sound statistical analysis where the variance could be used asthe basis of falsification.
The amusing thing is just how easy it is to manipulate this snarl of models to obtain any “average”prediction you like. Suppose we have only two models — G and B. G predicts moderate to low warming, gets things like cloud cover and so on crudely right,it is “good” in the sense that it doesn’t obviously fail to agree with empirical data within some reasonable estimate of method error/data error combined. B predicts very high warming, melting of the ice pack in five years,5 meter SLR in fifty years, and generally fails to come close to agreeing with contemporary observations, it is “bad” in the specific sense that it is already clearly falsified by any reasonable comparison with empirical data.
I, however, am a nefarious individual who has invested my life savings in carbon futures, wind generation,and banks that help third world countries launder the money they get from carbon taxes on first world countries while ensuring that those countries aren’t permitted to use the money to actually build power plants because the only ones that could meet their needs burn things like coal and oil.
So, I take model B, and I add a new dynamical term to it, one that averages out close to zero. I now have model B1— son of B, gives slightly variant predictions (so they aren’t embarrassingly identical) but still, it predicts very high warming. I generate model B2 —brother to B1, it adds a different term, or computes the same general quantities (same physics) on a different grid. Again, different numbers for this “new” model, but nothing has really changed.
Initially, we had two models, and when we stupidly averaged their predictions we got a prediction that was much worse than G, much better than B, and where G was well within the plausible range, at the absolute edge of plausible. But now there are three bad models,B, B1, and B2, and G. Since all four models are equally weighted,independent of how good a job they do predicting the actual temperature and other climate features I have successfully shifted the mean over to strongly favor model B so that G is starting to look like an absolute outlier.Obviously, there is no real reason I have to start with only two “original”GCMs, and no reason I have to stop with only 3 irrelevant clones of B.
Because I am truly nefarious and heavily invested in convincing the world that the dire predictions are true so that they buy more carbon futures, subsidize more windmills, and transfer still more money to third world money launderers, all I have to do is sell it. But that is easy! All of the models, G and B+ (and C+ and D+ if needed) are defensible in the sense that they are all based on the equations of physics at some point plus some dynamical (e.g. Markov) process. The simple majority of them favor extreme warming and SLR. There are always extreme weather events happening somewhere, and some of them are always “disastrous”. So I establish it as a well-known “fact” that physics itself — the one science that people generally trust — unambiguously predicts warming because a simple majority of all of these different GCMs agree, and point to any and all anecdotal evidence to support my claim. Since humans live only a pitiful 30 or 40 adult years where they might give a rat’s ass about things like this (and have memories consisting of nothing but anecdotes) it is easy to convince 80%of the population, including a lot of scientists who ought to know better, that it really, truly is going to warm due to our own production of CO_2 unless we all implement a huge number of inconvenient and expensive measures that — not at all coincidentally — line my personal pocket.
Did I mention that I’m (imaginarily)an oil company executive? Well, turns out that I am. After all, who makes the most money from the CAGW/CACC scare? Anything and everything that makes oil look “scarce” bumps the price of oil. Anything and everything that adds to the cost of oil, including special taxes and things that are supposed to decrease the utilization of oil, make me my margin on an ever improving price basis in a market that not only isn’t inelastic, it is inelastic and growing rapidly as the third world (tries to) develop. I can always sell all of my oil — I have to artificially limit supply as it is to maintain high profits and prolong the expected lifetime of my resources. Greenpeace can burn me in friggin’ effigy for all I care — the more they drive up oil costs the more money I make, which is all that matters. Besides, they all drive SUVs themselves to get out into the wilderness and burn lots of oil flying around lobbying “against” me. I make sure that I donate generously to groups that promote the entire climate research industry and lobby for aggressive action on climate change — after all, who actually gets grants to build biofuel plants,solar foundries, wind farms, and so on? Shell Oil. Exxon. BP. Of course.They/we advertise it on TV so people will now how pious the oil/energy industry is regarding global warming.
Not that I’m asserting that this is why there are so many GCMs and they are all equally weighted in the AR5average — that’s the sort of thing that I’d literally have to go into not only the internals of but the lineage of across all the contributing GCMs to get a feel for whether or not it is conceivably true. It seems odd that there are so many — one would think that there is just one set of correct physics, after all, and one sign of a correctly done computation based on correct physics is that one gets the same answer within a meaningful range. I would think that four GCMs would be plenty — if GCMs worked at all. Or five. Not twenty, thirty, fifty (most run as ensembles themselves and presenting ensemble averages with huge variances in the first place). But then, Anthony just posted a link to a Science article that suggests that four distinct GCMs don’t agree within spitting distance in a toy problem the sort of thing one would ordinarily do first to validate a new model and ensure that all of the models are indeed incorporating the right physics.
These four didn’t. Which means that at least three out of four GCMs tested are wrong! Significantly wrong. And who really doubts that the correct count is 4/4?
I’m actually not a conspiracy theorist. I think it is entirely possible to explain the proliferation of models on the fish tank evolutionary theory of government funded research. The entire science community is effectively a closed fish tank that produces no actual fish food. The government comes along and periodically sprinkles fish food on the surface, food tailored for various specific kinds of fish. One decade they just love guppies, so the tank is chock full of guppies (and the ubiquitous bottom feeders) but neons and swordtails suffer and starve. Another year betas (fighting fish) are favored — there’s a war on and we all need to be patriotic. Then guppies fall out of fashion and neons are fed and coddled while the guppies start to death and are eaten by the betas and bottom dwellers.Suddenly there is a tankful of neons and even the algae-eaters and sharks are feeling the burn.
Well, we’ve been sprinkling climate research fish food grants on the tank for just about as long as there has been little to no warming. Generations of grad students have babysat early generation GCMs, gone out and gotten tenured positions and government research positions where in order to get tenure they have had to write their own GCMs. So they started with the GCMs they worked with in grad school(the only ones whose source code they had absolutely handy), looked over the physics, made what I have no doubt was a very sincere attempt to improve the model in some way, renamed it, got funding to run it, and voila — B1 was born of B, every four or five years, and then B1′ born of B1 as the first graduated student graduated students of their own (who went on to get jobs) etc —compound “interest” growth without any need for conspiracy. And no doubt there is some movement along the G lines as well.
In a sane universe, this is half of the desired genetic optimization algorithm that leads to ever improving theories and models The other half is eliminating the culls on some sort of objective basis. This can only happen by fiat — grant officers that defund losers, period — or by limiting the food supply so that the only way to get continued grant support is to actually do better in competition for scarce grant resources.
This ecology has many exemplars in all of the sciences, but especially in medical research (the deepest, richest,least critical pockets the world has ever known) and certain branches of physics. In physics you see it when (for a decade) e.g. string theory is favored and graduate programs produce a generation of string theorists, but then string theory fails in its promise (for the moment) and supersymmetry picks up steam, and so on. This isn’t a bad ecology, as long as there is some measure of culling. In climate science, however, there has been anti-culling —the deliberate elimination of those that disagree with the party line of catastrophic warming, the preservation of GCMs that have failed and their inclusion on an equal basis in meaningless mass averages over whole families of tightly linked descendents where whole branches probably need to go away.
Who has time to mess with this? Who can afford it? I’m writing this instead of grading papers, but that happy time-out has to come to an end because I have to FINISH grading, meet with students for hours, and prepare and administer a final exam in introductory physics all before noon tomorrow. While doing six other things in my copious free moments. Ain’t got no grant money, boss, gotta work for a living…
Rgb
rgbatduke says:
On the subject of Monte-Carlo, some non-linear systems can give a very wide range of results which reflect the distribution of inputs that invoke the non-linearity. In my field, cardiac electrophysiology, this is particularly important and small changes in assumptions in a model will lead to unrealistic behavior. Even forming simple statistics with these results is wrong for the reasons you so eloquently state.Widely diverging results should force attention on the non-linear behavior that cause this divergence and a basic questioning of the assumptions.
Eloquently said right back at you.Computational statistics in nonlinear modeling is a field where angels fear to tread. Indeed, nonlinear regression itself is one of the most difficult of statistical endeavors because there really aren’t any intrinsic limits on the complexity of nonlinear multivariate functions. In the example I gave before,the correct many electron wave function is a function that vanishes when any two electron coordinates (all of which can independently vary over all space) are the same, that vanishes systematically when any single electron coordinate becomes large compared to the size of the atom, that is integrable at the origin in the vicinity of the nucleus (in all coordinates separately or together), that satisfies a nonlinear partial differential equation in the electron-electron and electron nucleus interaction, that is fully antisymmetric, and that obeys the Pauli exclusion principle. One cannot realize this as the product of single electron wave functions, but that is pretty much all we know how to build or sanely represent as any sort of numerical or analytic function.
And it is still simple compared to climate science. At least one can prove the solutions exist — which one cannot do in the general case for Navier-Stokes equations.
Does climate science truly standalone in failing to recognize unrealistic behavior when it bites it in the ass? Widely diverging results should indeed force attention on the non-linear behavior that causes the divergence and a basic questioning of the assumptions.Which is, still fairly quietly, actually happening, I think. The climate research community is starting to face up to the proposition that no matter how invested they are in GCM predictions, they aren’t working and the fiction that the AR collective reports are somehow “projective” let alone predictive is increasingly untenable.
Personally, I think that if they want to avoid pitchforks and torches or worse, congressional hearings,the community needs to work a bit harder and faster to fix this in AR5 and needs to swallow their pride and be the ones to announce to the media that perhaps the “catastrophe” they predicted ten years ago was a wee bit exaggerated. Yes, their credibility will take a well-deserved hit! Yes,this will elevate the lukewarmers to the status of well-earned greatness (it’s tough to hold out in the face of extensive peer disapproval and claims that you are a “denier” for doubting a scientific claim and suggesting that public policy is being ill advised by those with a vested interest in the outcome). Tough. But if they wait much longer they won’t even be able to pretend objectivity —it will smack of a cover-up, and given the amount of money that has been pissed away on the predicted/projected catastrophe, there will be hell to pay if congress decides it may have been actually lied to.
rgb
rgbatduke says:
Nick Stokes:Well, who did assemble it? It says at the top “lordmoncktonfoundation.com”.
Aw, c’mon Nick, you can do better than that. Clearly I was referring to the AR5 ensemble average over climate models, which is pulled from the actual publication IIRC. This is hardly the first time it has been presented on WUWT.
And the spaghetti graph is even worse. Which is why they don’t present it in any sort of summary — even lay people inclined to believe in CAGW would question GCMs if they could see how divergent the predictions are from each other and from the actual climate record over the last 33 years, especially with regard to LTT and SST and SLR. SLR predictions are a joke. SST predictions have people scrabbling after missing heat and magic heat transport processes. The troposphere is a major fail. Everybody in climate science knows that these models are failing, and are already looking to explain the failures but only in ways that don’t lose the original message, the prediction (sorry, “projection”) of catastrophe.
I’ve communicated with perfectly reasonable climate scientists who take the average over the spaghetti seriously and hence endorse the 2.5C estimate that comes directly from the average. It’s high time that it was pointed out that this average is a completely meaningless quantity, and that 2/3 of the spaghetti needs to go straight into the toilet as failed, not worth the energy spent running the code. But if they did that, 2.5C would “instantly” turn into 1-1.5C, or even less, and this would be the equivalent of Mount Tambora exploding under the asses of climate scientists everywhere, an oops so big that nobody would ever trust them again.
Bear in mind that I personally have no opinion. I think if anything all of these computations are unverified and hence unreliable science. We’re decades premature in claiming we have quantitative understanding of the climate. Possible disaster at stake or not, the minute you start lying in science for somebody’s supposed own benefit,you aren’t even on the slippery slope to hell, you’re already in it. Science runs on pure, brutal honesty.
Do you seriously think that is what the AR’s have produced? Honest reporting of the actual science, including its uncertainties and disagreements?
Really?
Rgb
rgbatduke says:
Disappear? How? Will someone PLEASE explain the mechanism to me?
One proposed mechanism is that e.g.UV light passes into the ocean bypassing the surface layer where absorbed IR turns straight into latent heat with no actual heating, warms it at some moderate depth, which is then gradually mixed downward to the thermocline
The catch is, the water in the deep ocean is stable — denser and colder than the surface layer. It turns over due to variations in surface salinity in the so-called “global conveyor belt” of oceanic heat circulation on a timescale of centuries, and much of this turnover skips the really deep ocean below the thermocline because it is so very stable at a nearly uniform temperature of 4 C. Also, water has a truly enormous specific heat compared to air, even dumping all of the supposed radiative imbalance into the ocean over decades might be expected to produce a truly tiny change in water temperature, especially if the heat makes it all the way down to and through the thermocline.
So one ends up with deep water that is a fraction of a degree warmer than it might have been otherwise (but nevertheless with a huge amount of heat tied up in that temperature increase)that isn’t going anywhere until the oceanic circulation carries it to the surface decades to centuries from now.
To give you some idea of how long it takes to equilibrate some kinds of circulation processes, Jupiter may well be still giving off its heat of formation from four and a half billion years ago! as it is radiating away more energy than it is receiving. Or there could be other processes contributing to that heat. Brown dwarf stars don’t generate heat from fusion, but nevertheless are expected to radiate heat away for 100 billion years from their heat of formation. The Earth’s oceans won’t take that long, but they are always disequilibrated with the atmosphere and land and act as a vast thermal reservoir, effectively a“capacitor” that can absorb or release heat to moderate more rapid/transient changes in the surface/atmospheric reservoirs, which is why Durham (where I live most of the year) is currently 5-10 F warmer outside than where I am sitting in Beaufort next to the ocean at this minute.
So if the “missing heat” really is missing, and is going into the ocean, that is great news as the ocean could absorb it all for 100 years and hardly notice, moderating any predicted temperature increase in the air and on land the entire time, and who knows,perhaps release it slowly to delay the advent of the next glacial epoch a few centuries from now. Although truthfully nobody knows what the climate will do next year, ten years from now, or a century from now, because our current climate models and theories do not seem to work to explain the past (at all!),the present outside of a narrow range across which they are effectively fit, or the future of whenever they were fit. Indeed, they often omit variables that appear to be important in the past, but nobody really knows why.
rgb
rgbatduke says:
Jeeze, Nick:
First of all, note “fig 11.33a” on the graph above. Second, note reproductions from the AR5 report here:
http://wattsupwiththat.com/2012/12/30/ar5-chapter-11-hiding-the-decline-part-ii/
Then there is figure 1.4:
http://wattsupwiththat.com/2012/12/14/the-real-ipcc-ar5-draft-bombshell-plus-a-poll/
Sure, these are all from the previously released draft, and who knows somebody may have fixed them. But pretending that they are all Monckton’s idea and not part of the actual content of AR5 at least as of five or six months ago is silly. If you are having difficulty accessing the leaked AR5 report and looking at figure 11.33, let me know (it is reproduced in the WUWT above, though so I don’t see how you could be). You might peek at a few other figures where yes, they average over a bunch of GCMs. Is Monckton’s graph a precise reproduction of AR5 11.33a? No, but it comes damn close to 11.33b. And 11.33a reveals the spaghetti snarl in the models themselves and makes it pretty evident that the actual observational data is creeping along the lower edge of the spaghetti from 1998/1999 (La Nina) on.
So, is there a point to your objection, or where you just trying to suggest that AR5 does not present averages over spaghetti and base its confidence interval on the range it occupies? Because 11.33b looks like it does, I’m just say in. So does 11.11a. So does 1.4, which has the additional evil of adding entirely idiotic and obviously hand drawn “error bars” onto the observational data points.
But where in AR5 does it say “these models appear to be failing”? Or just “Oops”?
Mind you, perhaps they’ve completely rewritten it in the meantime. Who would know? Not me.
rgb
Nick Stokes says:
rgbatduke says: June 13, 2013 at2:43 pm
“Jeeze, Nick:
First of all, note “fig 11.33a” on the graph above.”
Yes, but the graph is not Fig11.33a. Nothing like it.
You said, for example,
“Note the implicit swindle in this graph — by forming a mean and standard deviation over model projections and then using the mean as a “most likely”projection and the variance as representative of the range of the error, one is treating the differences between the models as if they are uncorrelated random variates causing >deviation around a true mean!.”
The AR5 graphs you linked to do not do any of that. No variance or standard deviation is quoted. They do show quantiles of the actual model results, but that is just arithmetic. At most they speak of an “assessed likely range”. There’s nothing anywhere about variance, uncorrelated random deviates etc. That’s all Monckton’s addition.
JJ says: June 13, 2013 at 2:47 pm
“And you understand quite well what he said. And yet you lie and pretend otherwise. Why must you lie, Nick?”
What an absurd charge. Yes, I understand quite well what he said. He said that the graphs that are shown area swindle, the maker should be bitch-slapped etc. And he clearly thought that hewas talking about the IPCC. But he got it wrong, and won’t admit it. The things he’s accusing the IPCC of are actually Monckton alterations of what the IPCC did.
Now you may think that doesn’t matter. But what does factual accuracy count for anyway, in your world.
rgbatduke says:
Clearly he thought he was referring to the IPCC, but the graph is labelled “Monckton”, and his diatribe matches the graph in this post. It does not match the AR5 graphs that he later linked to.
You mean, except for 11.33b, the graph following 11.33a that does precisely what Monckton claims. Perhaps the problem is the attribution. Perhaps he should have just referenced 11.33. Or1.4.
Also, Nick, I’m puzzled. When Trenberth et. al. talk about the current neutral temperature trend not being rejected by “the models” at the “95% confidence level” — a phrase I seem torecall hearing fairly repeatedly as warmists seek to reassure the world, the media, and the U. S. Congress that warming continues without a rise in temperature. I might have heard it a time or two in the overall AR5 report, as well.
What, exactly, does this“confidence” refer to? Does it mean that it is still not the case that 95% of the spaghetti snarl of GCM results (where even 11.33a is probably not showing all that are out there, in particular the individual runs within a model that might give us some idea of what the variance of future predictions is within a model and hence how robust they are to trivial perturbations of initial state) have failed miserably? That seems to be what you are suggesting.
Look, there are two ways one can do things. Either you can use real statistics, following the rules (which are there for a reason!) and reject most of the GCMs because they are falsified by the evidence one at a time because the concept of “ensemble of model results” as an entity with predictive force quite literally has no meaning,in spite of the fact that (as figures 1.4, 11.33, and others in AR5 make perfect clear, the IPCC desperately wants to convince the lay public and policy makers that it does, implying with every single lying figure that a“consensus” of model results should be given weight in a multi-trillion dollar decisioning process, or you can stop using terms like “confidence level” in climate science altogether. As it is, you seem to be suggesting that there is no criterion that you would consider falsification of the models, either individually or collectively.
Is this the case, or are you just picking nits over which figure or whether the figure captions (which generally do not explain precisely how their grey or light blue or whatever “ranges”supposedly representing error/variance are computed — personally I think somebody draws them in with a drawing program and the human eye because they are invariably smooth and appealing, unlike the snarl they usually hide from the public (for example, it is perfectly and laughably obvious that the“error bars” drawn onto the annual data in figure 1.4 were just made up and have no meaning whatsoever save to make it look like the figure is “science”)?
So let me extend the questions I raise to you personally. Do you think that the deviation of, say, the left most/highest models in 11.33a (the ones that are the farthest from reality over the last 15+ years) justifies their summary rejection as being unlikely to be correct? If not, why not?
If so, how far over and down do you think one should go rejecting models?
If you think it is reasonable to reject any of the models at all as being falsified, do you think it is “good science” to present them in the AR5 report in spite of the fact that nobody really takes them seriously any more (and believe me, even most climate scientists don’t seem to take Hansen’s ravings of 5+ C warming/century seriously any more, not after 1/7 of a century of neutral temperatures and a third of a century of ~0.1 C/decade temperature rise — e.g. UAH LTT)?
If it isn’t good science to present them on an equal footing with more successful (or not as glaringly failed) model predictions then why are they there — could it be because of political reasons — because without them the centroid of GCM climate results stops looking so, um “catastrophic”?
Do you think that the phrase“confidence” and the terminology of hypothesis testing has any purpose whatsoever in climate science (since as far as I can tell, nobody ever rejects a hypothesis such as “this particular GCM can be trusted when it predicts global warming even though it fails to predict rainfall, temperature,the coupling between surface temperatures and LTTs, or the variations in the major decadal oscillations better than a pair of broadly constrained dice”)?
For example, do you think that theAR4 “Summary for policy makers” should have included the phrases:“strengthening the confidence in near term projections”, or “Advances in climate change modelling now enable best estimates and likely assessed uncertainty ranges to be given for projected warming for different emission scenarios. Results for different emission scenarios are provided explicitly in this report to avoid loss of this policy-relevant information. Projected global average surface warmings for the end of the 21st century (2090–2099) relative to 1980–1999 are shown in Table SPM.3. These illustrate the differences between lower and higher SRES emission scenarios, and the projected warming uncertainty associated with these scenarios. {10.5}”?
When it presents figure SPM5 — as Multi-model global averages of surface warming with shading denotes the +/-1standard deviation of individual model annual averages and uses phrases such as “likely range” (emphasis theirs, not mine) is this utterly misleading? Do the authors of these documents need to be bitch-slapped?
Does the fact that graphics,commentary, and the abuse of statistical language used backwards — to suggest that the models have a 95% chance of being correct instead of not quite having made some arbitrary rejection threshold as they continue to deviate from reality — of almost identical nature are in the AR5 draft deserve any comment whatsoever?
In your opinion, of course. I’m just curious. Do you really think that this is all OK? I occasionally have the temerity to comment on /. on climate reposts, and there is a religious army that will come down on you like a ton of bricks if you assert that global warming or sea level rise will be less than 3 to 5 C or meters respectively,because there are many people who uncritically accept this crap about “95%confidence” completely backwards (who understands statistical hypothesis testing? Not even all statisticians…)
Do you think the end justifies the means?
Just curious.
rgb
rgbatduke says:
CO2 is a GHG, and its accumulation will make the world hotter. We have a real interest in knowing how much. GCM’s represent our best chance of finding out. We need to get as much information from them as we can. Doing nothing is not a risk free policy.
I think it is plausible that you are correct that the accumulation of CO_2 will make the world warmer. Doubling it from 300 ppm (by roughly the end of the century) might make it 1.2 C warmer that it was in 1955 or 1960, if all things were equal and we were dealing with a single variable linear problem. But we’re not. We’re dealing with a highly nonlinear, chaotic system were we cannot even predict the baseline behavior in the past, when it has exhibited variation much larger than observed over the last 40-50 years which is the entire extent during which we could possibly have influenced it with CO_2. Indeed, temperature increase in the first half of the 20th century bore a strong resemblance to temperature increase in the second half — as did reported behavior of e.g. ice melt in the arctic and more— until second half and first half records were adjusted and adjusted again until a cooling blip in the middle all but disappeared and the second half was artificially warmed compared to the first. Whether or not these adjustments were honest or dishonest is in a sense beyond the point — either way with satellite measurements of LTT it simply isn’t possible to continue to adjust the land record ever warmer than the LTT and hence in a decade or two the issue will be moot.
In a decade or two many issues will be moot. I am not a “denier” or a “warmist” — I am simply skeptical that we know enough to model the climate when we don’t even understand how to incorporate the basic physics that has driven the climate into a model that can quantitatively hind cast the last million years or so. And no, I do not buy into the argument that we can linearize around the present — not in a nonlinear chaotic system with a nonlinear past that we cannot explain. If the climate is chaotic — and note well, I did not say the weather — then we probably cannot predict what it will do, or even what it will “probably” do, CO_2or no CO_2. If it is not chaotic, and is following some sort of predictable behavior that we might be able to linearize around, well — predict it.In the past.
You point out that doing nothing is not a risk free policy. Absolutely true. However, doing something isn’t a risk free action — it is a guaranteed cost! You are simply restating Pascal’s Wager, in the modern religion of sinful human caused global warming. Let me clarify.
Pascal, of course, said that even though the proposition that God exists was (your choice of) absurd or improbable or at the very least unprovable and lacking proper evidence, the consequences of believing and being wrong were small compared to the consequences of not believing and being right. A slightly wiser man than Pascal— such as the Buddha — might have then examined what the real costs were(tithing the priesthood, giving up enormous amounts of political power to the religion-supported establishment feudal government, wasting countless hour spraying and attending sermons where somebody tells you how to think and behave,all of the attendant distortion of human judgment that occurs when one accepts false premises on important matters such as a worldview) and just who it was that wrote the book describing the consequences of disbelief (that same priesthood, hmmm), but Pascal took them at their word that a being capable of creating a Universe and supposedly being perfectly loving would throw humans into a pit of eternal torture for the sin of failing to be convinced of an absurdity by the priesthood. Hence one could “prove” that the costs on one side paid immediately, however great, were less than the expectation value of the future costs on the other side, however unlikely. Infinity/eternity times even a tiny chance exceeds a mere lifetime of tithing etc.
This is the modern climate science wager as well. You remain unconvinced that the GCMs are wrong in spite of the fact that whether you plot the spaghetti in quantiles or standard deviations(where I note that you have not responded to my observation that AR4 plotted both mean and standard deviation of precisely these spaghetti curves and furthermore made claims of likelihood, and there isn’t the faintest reason to think that AR5 won’t do exactly the same thing, in the guide to policymakers, not the scientific sections that nobody but scientists and not all of them ever read) the current climate has diverged pretty much outside of the envelope of all of them.
I ask you again to invert your belief system and reorient it back towards the accepted one within the general realm of science. We do not know if the GCMs are trustworthy or corrector implement their physics appropriately. It is a nontrivial question because the climate is chaotic and highly nonlinear, because there are many different types of models, and because the models do not even make predictions in good agreement with each other in toy problems. We do not know the physics and feedback associated with many of the assumptions built into the models — clouds and water vapor being an excellent example — well enough to trust it without some sort of confirmation, some evidence that it the models are capable of predicting the future or hindcasting the indefinite past.
Do you consider the deviation of observed temperatures from the entire range predicted by these inconsistent models from observed temperatures to be evidence for the GCMs being trust worthy? If you answer yes, then I have to conclude that you have fully embraced CAGW as a religion, not as science. Note that I didn’t say “proven” or “disproven”. One does not verify or falsify in science (and yes, I’m perfectly happy to tackle anyone on list who is a Popperite) — one increases or decreases one’s degree of belief in propositions based on a mix of consistency and evidence. Negative evidence (including failure to agree with predictions in a reasonable manner) either decreases degree of belief or you have given up reason altogether, just as positive evidence should increase it.
If you agree — as I hope that you do— that the lack of agreement is troubling and suggests that perhaps, just maybe, these models are badly wrong since the current climate is diverging from the entire envelope of their predictions (which were themselves averages over ensembles of starting conditions, presuming some sort of ergodicity that of course might be utterly absent in a chaotic system or a system with many non-Markovian contributions with many timescales from the past and with the possibility — nay, the observed certainty — of spin-glass-like“frustration” in its internal dynamics on arbitrarily large timescales) then this should cause you to take a hard look at the entire issue of certain costs versus risks versus benefits because changes in the plausibility/probability of downstream disaster have enormous impact on the expected costs of action versus inaction, and even on which actions are reasonable now and which are not.
For example, on youtube right now you can watch Hansen’s TED talks video where he tells the entire world that he still thinks that sea level will rise 5 meters by the end of the century. 5meters! Do you agree with that? Do you think that there are ten actually reputable climate scientists on Earth who would agree with that? Bear in mind that the current rate of SLR — one that has persisted for roughly 140 years with only small variations in rate — is 1.6 mm/year (plus or minus around1.5 mm). 9 inches since 1870 according to the mix of tide gauge and satellite data. This is the same Hansen who conspired to turn off the air conditioning inthe US congress on the day he made a presentation to them to sufficiently convince them that CAGW was a certain danger and that they should fund any measures necessary to prevent it. Trenberth, OTOH — sadly, so committed to CAGW that he can hardly afford to back out now but probably a basically honest person — fairly recently called for 30 cm by the end of the century, a number that is a linear extrapolation of the current rates but at least isn’tradically implausible — a foot in 90 years, or a bit over an inch a decade.
Five meters is Pascallian — sixteen or seventeen feet, a disaster beyond imagining, morally equivalent to eternal damnation. Trenberth’s assertion, on the other hand, is completely ignorable — just like nobody even noticed the 9 inch rise over the last century plus or is noticing the current (supposed) 3 mm/year, nobody will notice it if it continues decades or longer. Certainly there is reason for alarm and the urgent expenditure of trillions of dollars to ameliorate it.
Let me explain the real cost benefit of CAGW to you. The money spent on it by Europe so far would have prevented the recent monetary crisis that almost brought down the Euro, which in turn might have triggered a global depression. Why do you think that Europe is backing off of CAGW? Because there has been no warming observed pretty much from when Mann’s infamous hockey stick was first published and used to wipe out the MWP and LIA that “inconveniently” caused people with ordinary common sense to doubt that there was a catastrophe underway, and screw a disaster in 2100, the monetary crisis amelioration has helped cause is a disaster right now.
It’s a disaster right now in the US.We’re all spending a lot more for gasoline, coal, and oil derived products because the energy companies love CAGW, and probably help fund the hysteria. They make a marginal profit on retail cost, demand is almost entirely inelastic, and anything that makes prices rise is good for them. We pay substantially more for electricity than we probably need to, especially in states like California. We can “afford” this only because we are so very very wealthy and because none of the measures we take to ameliorate CAGW will even according to their promoters have any significant impact on it in the future,while measures we are taking for purely selfish and economical reasons (using lots of natural gas, for example) turn out to have a large impact on carbon utilization.
And of course the same anti-civilization priests that preach the sin of burning carbon preach the even bigger sin of taking any of the measures that might actually work to ameliorate hypothetical CAGW caused by CO_2 such as building lots of nuclear power plants or investing heavily in LFTR. Western North Carolina alone could provide 100% of the energy requirements of the entire world for some 17,000 years, and mining it of course produces lots of the rare earths that are equally valuable for use in magnets and energy storage devices that might make electric cars ultimately feasible (at the moment, thorium is viewed as toxicwaste when mining rare earths, which is why the US imports them all continuing our tradition of simply exporting our pollution).
But the real disaster, the big disaster, the ongoing catastrophe, the most tragic aspect of the religion of CAGW is that all of the measures we have taken to combat it, with their moderate to severe impact in the first world, have come at the expense of the third world. The third world is suffering from energy poverty above all else. Energy is, of course, the fundamental scarcity. With enough, cheap enough, energy, one can make the desert bloom, build clean water and sewage systems, fuel industry, fuel transportation, fuel communication. Most people living in the first world cannot imagine life without clean running water,flushable toilets, electric lights, air conditioning, cell phones, computers and the Internet, cars, supermarkets, refrigerators, stoves, washing machines,but I grew up in India and I could literally see that life happening outside of my first-world window in the heart of New Delhi. I cited a TED talks of evil featuring Hansen up above — if you want to watch a TED talks of good, google up the one on washing machines. Washing machines are instruments where you put in dirty clothes on one side and take out books on the other side. You take out time, and wealth, and quality of life on the other side. And this cannot begin to compare to India, where there isn’t any water to wash clothes in for the poorest people unless they live near a river or it is the Monsoon.
Every measure we erect to oppose the development of carbon based energy raises prices, and raising prices has a devastating impact on the development of the third world. Worse, the money we spend in the first world comes out of money we might otherwise spend in useful ways on the economic development of the third world — we have finite resources, and spending more on one thing means spending less on another. If we spent just one of the billions of dollars we spend a year on CAGW on global poverty, how many lives would we save (save from death, save from disease, save from poverty,save from hopelessness), mostly of children? Millions, easily. A year.
So next time you want to talk about the “risk” of doing nothing, make sure you accompany it with the immediate cost of doing something for a problem that might or might not actually exist, whose impact (if it does indeed exist) could range from ignorable, as in a 30 cm SLR by 2100 to “catastrophic” (let’s say a whole meter of SLR by 2100, since only crazy people who are convinced that they are the religious salvation of humanity think it will be five), but a problem that will largely sort itself out even if we do nothing in a decade and beyond as technologies such as solar cells and (we can hope) LFTR and maybe long-shot thermonuclear fusion make burning carbon for energy as obsolete as TV antennas on top of houses within two decades not to “save the world” but to save money.
In case you wonder if I think there are measures worth taking to ameliorate the risk of CAGW, I would answer certainly. Here is a list. All of these measures have a guaranteed payout in the long run regardless of whether or not CAGW is eventually borne out not by the current crop of GCMs but by observational science and models that actually work. None of them are horribly expensive. None of them are the equivalent of “carbon trading”, “carbon taxes”, or other measures for separating fools from money, and all of them would be supported as part of the general support of goodscience.
* Invest heavily in continuing to develop natural gas as a resource. This is actually real-time profitable and doesn’t need a lot of government interference to make happen.
* Invest heavily in fission based power plants. I don’t think much of pressurized water Uranium plants, although I think that with modern technology they can be built pretty safely. But however you assess the risk if you really believe in a global calamity if we burn carbon, and do not want to go back to outhouses, washing clothes by hand in a river and going to bed at sundown and living in houses that are hot in the summer and freezing cold in the winter, fission plants are surely better than that.
* Invest in building LFTR and other possible thorium-burning fission designs. Start mining the thorium we’ve got and extracting our own rare earth metals for use in things like super-magnets (thereby driving down world prices in the process).
* Continue to invest in fusion and solar cell and storage device research at an aggressive level, without subsidizing their premature adoption.
* Back off on all measures intended to reduce the burning of carbon for energy and nothing else until there is solid observational evidence of not only warming, but catastrophic warming. Try to actually do real cost-benefit analysis based not on Pascal’s wager and mass public hysteria caused by the likes of Hansen, but on observational data backed by real knowledge of how the climate works, once we have any.
* And sure, continue to do climate research, but at a vastly reduced level of public funding.
Hansen succeeded in one thing — he caused the diversion of billions of dollars of public funding into climate science over more than two decades. If you want yet another horrendous cost — funding climate research intended to prove that if temperatures increase 5 C by 2100, it will be bad for tree frogs in the amazon instead of funding research into thorium, funding research on dumping massive amounts of iron into the ocean to supposedly increase its rate of CO_2 uptake instead of increasing the funding of fusion research, or research and development of vaccines, or development of water sanitation projects in third world countries,or the development of global literacy programs, or name almost anything that could have been done with the money pissed away in an over funded scientific diversion that might yet turn out to be completely incorrect— net feedback from CO_2 increases could be negative to the point where the climate is almost completely insensitive to CO_2 increases (as has been quite seriously and scientifically proposed, and which is rather consistent with the evidence of the last 33 years of high-quality empirical observations of e.g. LTTs and SSTs).
Personally, I will believe that even the proponents of the CAGW, now CACC (since there is no visible warming,the marketing has changed to “climate change” in order to try to perpetuate the Pascallian panic) truly believe the kool-ade that they would have us all drink the day that they call for us to build fission plants of one sort or another as fast as we can build them. In the meantime, I will continue to think that this whole public debate has a lot less to do with science, and a lot more to do with money, power, and an unholy alliance between those who want to exploit the supposed risk of disaster to their own direct and personal monetary benefit and those who hate civilization itself, who think that the world has too many people living in it and who are willing to promote any lie if it perpetuates the cycle of poverty and death that limits third world population growth, if it has any chance of topping the civilization that they perceive of as being run by the wealthy and powerful at their personal expenses.
rgb
rgbatduke says:
In my opinion, Santer made apolitical statement so it should be answered with a political response: i.e. itshould be insisted that he said 17 years of no global warming means noanthropogenic global warming because any anthropogenic effect would have beenobserved.
Santer made his petard and he should be hoisted on it.
Richard”
Well put. He made a political statement because there is no possible equivalent scientific statement that can be made. Why not? Because we have no idea what the climate is“naturally” doing, has done, or will do. In physics, we tend to believe F =ma, so that as long as we can measure a and m, we can infer F. If we have asystem with a number of well-known forces acting on a mass, and we observe its acceleration, and it isn’t consistent with the total force given the forces we understand, then we might possibly be forgiven for inferring the existence of anew force (although cautious physicists would work very hard to look for confounding occurrences of known forces in new ways before they went out on a limb and published a paper asserting the definite existence of a newforce). This is, in fact, how various new elementary particles were discovered— by looking for missing energy or momentum after tallying up all that we could observe in known channels and inferring the existence of particles such as a neutrino needed to to make energy and momentum conservation work out.
Now, try doing the same thing when we do not have the moral equivalent of F = ma, when we do not know the existing force laws, when we cannot even predict the outcome of a givenexperiment well enough to observe a deviation from expected behavior because there is no expected behavior. That it what modern climate science attempts to do.
We have no idea why the world emerged from the Wisconsin glaciation. We are not sure why it re-descended briefly into glaciation in the Younger Dryas. We cannot explain the temperature record inproxy of the Holocene, why for some 8000 or 9000 years it was warmer than it is now, then why it cooled in the LIA to the coldest global temperatures observed in the entire Holocene, or why it warmed back up afterwards (to temperatures that are entirely comparable to what they were for most of the Holocene, although still a degree or so cooler than most of it). We are completely clueless about the Pliestocene Ice Age we are still in, and cannot predict or explain the variable periodicity of the interglacials or why the depth of the temperature variation in the interglacial/glacial episodes appears to be growing. We do not know why the Pliestocene began in the first place. We do know understand why most of the last 60 million years post-Cretaceous was warm,except for several stretches of a million years or more where it got damn cold for no apparent reason and quite suddenly, and then warmed up again equally suddenly.
On shorter time scales, we cannot explain the MWP, the LIA, or the modern warm period. Most of all three were variations that occurred completely independent of any conceivable human influence, and yet were similar in magnitude and scope and timescale of variation. The only thing CO_2 increase is supposed to be responsible for is the temperature increase observed from roughly 1955 on (before that anthropogenic CO_2 was pretty ignorable) and temperature didn’t even begin to rise until fifteen to twenty years after the supposedly anthropogenic CO_2 did. It then inconveniently rose sharply for as much as 30 years — more or less sharply depending on whether you use data accrued before the early 90′s before or after it was “adjusted” to show far more late century warming and far less early century warming — but then stopped after one final burst associated with the super El Nino and the following equally super La Nina in 1998-1999. In the meantime, CO_2 continued to increase but temperatures have not. And they cannot be “adjusted” to make them warmer any more because whatever you do to the surface record, the lower troposphere temperature cannot be finagled and surface temperatures have already diverged further from them and from the SSTs than one can reasonably believe over the time the latter two have reliably been recorded.
We cannot determine the human influence because we do not know what the non-human baseline would have been without it. I do not believe that we can know what it would have been without it, certainly not with existing theory.
rgb
rgbatduke says:
1) I understand the satellite measures the entire column of atmospheric CO2, so even if CO2 is more uniform in the upper atmosphere, the reading would be skewed by the levels closer to the surface; and vice-versa, although less so because the absolute amount ofCO2 decreases with altitude.
Did you notice the other oddity?There is no possible way that the Japanese satellite measurement OF the entireair column supports global CO_2 on the edge of 400 ppm. Eyeballing the graphs the means should be what, 380 ppm, and as you note, it should be skewed high compared to Mauna Loa, not low.
I’m thus troubled by what appears tobe a 5 or 6% error in normalization. That’s actually a rather lot. Mauna Loa iswhat it is, whether or not you approve of its data reduction methodology at least it has been consistently applied for a long time so its own value is apples-to-apples. But it has been used as a sort of gold-standard of global atmospheric CO_2, and I’d rather bet that its readings are used as primary input into the GCMs.
The satellite data suggests manythings. First, that the Mauna Loa readings are a lousy proxy for global CO_2levels. Second, that they are far too high — as you note, if CO_2 concentration on average increases with depth (which makes moderate sense and is consistent with it not being perfectly homogeneous over the globe as it is) then the mountain top reading should be lower by some percentage than the mean of the entire air column, not higher. Given that surface readings are frequently in the 400 to 500 ppm (depending on where you look) Mauna Loa could be off by 10% or 20% on the high side compared to true top-of-the troposphere average CO_2 concentration. Since that is where the atmosphere nominally becomes transparent to LWIR emitted from the CO_2 because the atmosphere itself has thinned to the point where it is no longer optically opaque, this suggests that the emission temperature being used in the models is derived from a point too high in the DALR (and hence too cold) — there by exaggerating warming.
If it “only” a 5% effect I’d worry but perhaps it isn’t “important” (bearing in mind that the entire post-LIA warming in degrees Kelvin is order of 0.5%, so small numbers cannot safely be ignored when trying to explain the 0.1-0.2% that might be attributable to anthropogenic causes). If Mauna Loa is off by 10% or more for any reason whatsoever, that cannot possibly be ignorable. For example, if top of the troposphere global mean CO_2 were really 370 ppm and not 400 ppm, that’s a huge difference.
One wonders if there are any reliable controls. The other possibility is of course that the satellite isn’t correctly normalized. One wonders if contemporaneous soundings support one or the other. That actually might be a large enough error to kick the GCM spaghetti back down into agreement with nature all by itself, although systematically correcting them back in time is going to be very difficult. One also wonders why Mauna Loa produces so very different a number (just as one wonders why LTT is diverging from land surface temperature records, or was until they stopped adjusting it because they had to after one final push of all the older temperatures down).
rgb
rgbatduke says:
The data I’m looking at for April isconsistent with 400ppm:
https://data.gosat.nies.go.jp/GosatBrowseImage/browseImage/fts_l2_swir_co2_gallery_en_image.html?image=46
Fair enough, but one wonders whyAugust of 2012 was then so very different from April 2013. Did they renormalize their detectors to get agreement?
As for the comment about polar cooling and TOA descending to ground level, this is something that has occurred to me as well. The DALR from ground level to the tropopause is determined, among other things, by the height where GHGs cease to be optically opaque and lose their heat content to space. Above the tropopause the stratosphere begins, which is hotter than the top of the troposphere, in part because the ordinary atmosphere no longer has any radiative cooling channel. In polar inversions with very dry air (and hence very little GHE), one essentially drops the stratosphere/tropopause down to the ground — I recall there is aspectrograph pair in Perry that illustrates this case.
This makes me less sure about just what the temperature profile would be in a mythical planet covered in just oyxgen-nitrogen-argon, no H2O or CO2 or ozone or GHGs per se, or better yet, a planet with a Helium atmosphere. The ground would radiatively heat and cool unopposed, like the moon, so from one point of view one would expect it to get very hot in the day, very cold at night, not unlike the low humidity desert does now.
But not exactly like the desert, because the DALR doesn’t break down over the desert and in this mythical planet the tropopause would basically be at ground level, and temperatures would ascend from the ground up, just as the stratosphere warms to the thermosphere only far overhead. Then my imagination breaks down.Such an atmosphere would have basically no cooling mechanism overhead until it gets hot enough to activate SWIR bands in the non-GHG atmosphere, say thousands of degrees. It might well be that it cools by contact with the ground at nighttime because the ground is an efficient radiator where the atmosphere is not. The atmosphere would, however, be densest and coolest at the bottom, and cooling there would not generate surface convection.
However there would be differential heating and cooling between the equator and the poles, and differential heating and cooling from daytime to nighttime, so there would be some general circulation — cold air from the poles being pushed south, uplifting as it heats, displacing hotter upper air poleward, and forcing it down to contact the colder surface there, which might well still make such an atmosphere net heating. IIRC, one of the moons — Triton? — has such an atmosphere and a moderately uniform surface and might serve as a sort of laboratory for this kind of model, although its density and mean temperature are of course way off for applicability to Earth.
One of our many problems is that we just don’t have enough, simple enough, planets to study to get a good feel for planetary climatology. It is so easy to make some simplistic assertion that captures one “linearized” cause-effect relationship and then fail to realize that in the real world four other nonlinear relationships are coupled in such away that the hypothesized linearized relationship is not correct, it is at best valid in the neighborhood of “now” in a single projective direction of a complex, curved, surface, the projection of the first term in a Taylor series expansion of a solution to a multivariate nonlinear partial differential equation. So stating that CO_2 is “cooling at the poles” might better be stated as “sometimes, when conditions are just right, CO_2 can contribute to net cooling at the poles”. But this is probably a smaller effect globally than the statement that “sometimes, when the conditions are just right, water vapor is strongly net cooling; other times when the conditions are just right, water vapor is net warming; the conditions that regulate which it is might well depend on aerosol levels, soot/particulate levels, solar magnetic state, geomagnetic state, time of year, macroscopic state (e.g. water content) of the stratosphere, the phase of the decadal oscillations, the phase of the moon, and who won the superbowl”. And since water vapor is by far the dominant GHG,getting the global climate answer approximately correct depends on getting it right first, and only then worrying about what happens with CO_2.
rgb
rgbatduke says:
Some Moncktonesque statistical treatment here, what exactly does “bounded by the means of the trends on these published uncertainties” mean in relation to statistical significance? Using the same data I obtained a trend of 0.089±0.118 ºC/decade which indicates statistically significant warming at the 85% level. To say that there has been“no statistically-significant warming in 17 years 4 months” as Monckton does is meaningless.
Not wanting to speak for Mr.Monckton, of course, but I suspect he is referring to for the linear fit, usually interpreted as a measure of the significance of the fit compared to the null hypothesis of no relationship. I also think he is using “accepted” values for the conclusion, which a lot of people have grudgingly been coming to accept in the climate community.
At the same time, I completely agree with you. There is nothing special or magical about 17 years, or 16 years, or 13 years. Or rather, there might well be, but we don’t know what it is because we do not actually know the relevant time scales for variation of the climate as opposed to the weather. The climate as reflected in some sort of average global temperature derived from either the thermometric record or proxies has never been constant, never been linear, never had anything like a single time constant or frequency that could be associated with anything but a Taylor series/power series fit to some sufficiently small chord or fourier transform ditto. Well, I take that back — there is a pretty clear fourier signal associated with Milankovitch processes over the last 3.5 million years, only the period changes without warning three times over that interval (most recently to roughly 100 ky) and we don’t know why.
The much better way to assert precisely the point Monckton makes above is by asserting no point at all— simply presenting the actual e.g. LTT and SST and LST records over the last 34 years where LTT, at least, is consistently and accurately measured, SST is increasingly precisely measured, and sadly, LST estimates are comparatively dubious. Over that entire interval, LTT (as arguably the best measure of actual warming for a variety of reasons) suggests a non-catastrophic warming rate onthe order of 0.1 C/decade but with (obviously!) large error bars. SSTs lead to a similar conclusions. Measurements of SLR (any mix of tide gauge data andsatellite) lead to a similar conclusion.
Deconstructing the causes of the warming, decomposing it into (say) a flat fit pre-1997 and a second flat fit post-1999 (which reveals that most of the warming occurred in a single discrete event associated with the super-El Nino/La Nina pair in between as far as we can tell from the data) or a linear fit, or an exponential fit,or throwing new fourier, linear, or otherwise functional components in coincidence with decadal oscillations, the solar cycle, the level of solar activity, CO_2 concentrations, stratospheric water vapor, stratospheric ozone,or the density of kitchen sinks (per household) in Zimbabwe is in some sense all complex numerology, climatological astrology. The temperature record is what it is, not what we would fit it to be, not the stories we make up to explain it because we damn sure cannot compute it!
That’s the real mistake Monckton made — he presented an aggregate view of the GCMs, because that is what the IPCC did in its notorious AR4 summary for policy makers, which contains an absolutely horrendous abuse of statistics by using the averages and standard deviations of model results over many completely different GCMs to make quantitative assertions of the probabilities of various warming scenarios as if “structure of a particular climate GCM” is an independent,identically distributed variable and reality is somehow bound to the mean behavior averaged over this variable by the central limit theorem which is sheer madness. This isn’t Monckton’s error, it is a standard error made by the IPCC, an error where incompetence in statistical analysis is beautifully married to political purpose to the detriment of scientific reasoning), but he perhaps should have avoided perpetuating it (as Nick Stokes rather over vehemently insisted above and just presented the spaghetti snarl of actual GCM model results themselves as they say precisely the same thing, only better, without the irrelevant and incorrectly computed probabilities.
Madness and incorrect computation that is, of course, perpetuated and reflected in your citing 0.089±0.118ºC/decade which indicates statistically significant warming at the 85% level..Let’s restate this in Bayesian language. If there is no bias in the process associated with generating the points being fit (an assumption we can frame as aprior probability of there being occult bias), if the underlying climate is a linear function (an assumption we can frame as the prior probability of the climate behaving linearly over some interval of time,an assumption we can actually make at least semi-quantitative if one can believe the proxy record over the Holocene and bewares the fact that much of that proxy is intrinsically coarse grain averaged over intervals longer than 33years), if the error bar you obtain from a linear fit (presumably from the distribution of Pearson’s ) over a remarkably short interval where we do not know the timescales of the relevant noise compared to the linear trend is relevant(again, one can try to guestimate the probable time scales of noise compared tothe fit interval, but the curve itself strongly suggests that the two are comparable as it decomposes into two distinct and quite good fits joined at the ENSO in the middle), and if there is nothing else going on that we, in our ignorance, should be correcting for, then your linear fit yields warming with a considerably wider variance than you are allowing for — none of the Bayesian probabilities above are optimal for the linear fit to be precisely meaningful, and the uncertainties they introduce all broaden the uncertainty ofthe result or worse, reflect the probability that the linear fit itself is nonsense and cannot be extrapolated with any real confidence at all.
I strongly suggest that you read the Koutsoyiannis paper on hydrology that has as it first graphic a function plus noise at a succession of time scales (in fact, Anthony, this graph should be a front-page feature on WUWT somewhere, IMO, as a permanent criticism of the plague of linearizing a function we know is nontrivially nonlinear). On a short enough timescale it appears linear. Then it appears exponential. Then it appears sinusoidal. But is that really its behavior? Or is the sinusoidal merely systematic noise on a longer term linear behavior? Note that no possible statistical analysis on the original fit interval can reveal the truer longer time behavior, and at no time can one separate out the unknown longer time behavior from the fit.
In the meantime, here is a statement that perhaps everybody — even Nick Stokes and in other venues Joel Shore — can agree with. The last 15 to 17 years of the climate record — depending on which side of the discrete “event” of the 1997/1998 ENSO you with to start on — are not strong evidence supporting the hypothesis of catastrophic anthropogenic whatever, global warming, climate change. So much so that the warmist community stopped using the phrase global warming over this interval,substituting the non-falsifiable term “climate change” instead because any weather event can safely be attributed to human activity and who can prove you wrong other than by asserting statistical arguments so abstruse that any member of the lay population will fall asleep long before you finish them, where the catastrophe itself is always immediate and exciting and real to them. Every experience is a peak experience if you are demented and forget past experiences, after all.
Note that I carefully avoid stating that the data “falsifies” the assertion of CAGW, AGW, or any particular “scenario” put forth in AR4′s summary for policy makers. To make such an assertion I would have to have prior knowledge that not only I lack, but everybody lacks. The issue of e.g. UHI bias and cherry picking in the contemporary land surface temperature record is an open question at this point, with evidence supporting both sides. Who really knows if there is a bias, what the sign of the bias is, what the magnitude of the bias is? Even given the best possible intentions and totally honest scientists constructing it, totally honest scientists have biases and often cannot help incorporating them into their database — an assertion I make with considerable empirical evidence derived from meta-studies in e.g. medical science.
There is considerable unacknowledged uncertainty in climate science — the egregious treatment of various Bayesian priors as equal to unity or zero (in a way that reflects one’s prejudices on the issue) in order to avoid diluting the purity of one’s conclusions with the inconvenient truth of uncertainty. But quite independent of Bayes, it is entirely safe to say that an interval of essentially flat temperatures does not support the assertion of aggressive, catastrophic, global warming.Indeed, 13 years (starting MOST generously in the year 2000) is 1/8th of acentury. If 1/8th of the twenty first century has been climate neutral in spite of a significant increase in CO_2 in that time and over an interval in which the GCMs unanimously call for aggressive warming, one would have to lack simple common sense to assert that this is evidence for the correctness of the GCMs and the likelihood of a catastrophic warming increasingly confined to the7/8 of the century remaining.
rgb
rgbatdukesays:
Sorry, I missed the reposting of my comment. Firstof all, let me apologize for the typos and so on. Second, to address Nick Stokes in particular (again) and put it on the record in this discussion aswell, the AR4 Summary for Policy Makers does exactly what Idiscuss above. Figure 1.4 in the unpublished AR5 appears poised to do exactly the same thing once again, turn an average of ensemble results, and standard deviations of the ensemble average into explicit predictions for policy makers regarding probable ranges of warming under various emission scenarios.
This is not a matter of discussion about whether it is Monckton who is at fault for computing an R-value or p-value from the mish-mosh of climate results and comparing the result to the actual climate —this is, actually, wrong and yes, it is wrong for the same reasons I discuss above, because there is no reason to think that the central limit theorem and by inheritance the error function or other normal-derived estimates of probability will have the slightest relevance to any of the climate models, let alone all of them together. One can at best take any given GCM runand compare it to the actual data, or take an ensemble of Monte Carlo inputs and develop many runs and look at the spread of results and compare THAT to the actual data.
In the latter case one is already stuck making a Bayesian analysis of the model results compared to the observational data (PERmodel, not collectively) because when one determines e.g. the permitted range of random variation of any given input one is basically inserting a Bayesian prior (the probability distribution of the variations) on TOP of the rest ofthe statistical analysis. Indeed, there are many Bayesian priors underlying the physics, the implementation, the approximations in the physics, the initial conditions, the values of the input parameters. Without wishing to address whether or not this sort of Bayesian analysis is the rule rather than the exception in climate science, one can derive a simple inequality that suggests that the uncertainty in each Bayesian prior on average increases the uncertainty in the predictions of the underlying model. I don’t want to say proves because the climate is nonlinear and chaotic, and chaotic systems can be surprising, but the intuitive order of things is that if the inputs are less certain and the outputs depend nontrivially on the inputs, so are the outputs less certain.
I will also note that one of the beauties of Bayes’theorem is that one can actually start from an arbitrary (and incorrect) prior and by using incoming data correct the prior to improve the quality of the predictions of any given model with the actual data. A classic example of this is Polya’s Urn, determining the unbiased probability of drawing a red ball from an urn containing red and green balls (with replacement and shuffling of the urn between trials). Initially, we might use maximum entropy and use a prior of 50-50 — equal probability of drawing red or green balls. Or we might think to ourselves that the preparer of the urn is sneaky and likely to have filled the urn only with green balls and start with a prior estimate of zero. After one draws a single ball from the urn, however, we now have additional information — the prior plus the knowledge that we’ve drawn a (say)red ball. This instantly increases our estimate of the probability of getting red balls from a prior of 0, and actually very slightly increases the probability of getting a red ball from 0.5 as well. The more trials you make(with replacement) the better your successive approximations of the probability are regardless of where you begin with your priors. Certain priors will, of course, do a lot better than others!
I there fore repeat to Nick the question I made on other threads. Is the near-neutral variation in global temperature for at least 1/8 of a century (since 2000, to avoid the issue of 13, 15, or 17 years of “nosignificant warming” given the 1997/1999 El Nino/La Nina one-two punch since wehave no real idea of what “signficant” means given observed natural variability in the global climate record that is almost indistinguishable from the variability of the last 50 years) strong evidence for warming of 2.5 C by the end of the century? Is it even weak evidence for? Or is it in fact evidence that ought to at least some extent decrease our degree of belief in aggressive warming over the rest of the century, just as drawing red balls from the urn ought to cause us to alter our prior beliefs about the probable fraction of red balls in Polya’s urn, completely independent of the priors used as the basis of the belief?
In the end, though, the reason I posted the original comment on Monckton’s list is that everybody commits this statistical sin when working with the GCMs. They have to. The only way to convince anyone that the GCMs might be correct in their egregious predictions of catastrophic warming is by establishing that the current flat spell is somehow within their permitted/expected range of variation. So no matter how the spaghetti of GCM predictions is computed and presented —and in figure 11.33b — not 11.33a — they are presented as an opaque range, BTW, — presenting their collective variance in any way whatsoever is an obvious visual sham, one intended to show that the lower edge of that variance barely contains the actual observational data.
Personally, I would consider that evidence that,collectively or singly, the models are not terribly good and should not betaken seriously because I think that reality is probably following the most likely dynamical evolution, not the least likely, and so I judge the models on the basis of reality and not the other way around. But whether or not one wishes to accept that argument, two very simple conclusions one has little choice but to accept are that using statistics correctly is better than using it incorrectly, and that the only correct way to statistically analyze and compare the predictions of the GCMs one at a time to nature is to use Bayesian analysis, because we lack an ensemble of identical worlds.
I make this point to put the writers of the Summary for Policy Makers for AR5 on notice that if they repeat the egregious errormade in AR4 and make any claims whatsoever for the predictive power of the spaghetti snarl of GCM computations, if they use the terms “mean and standard deviation” of an ensemble of GCM predictions, if they attempt to transform those terms into some sort of statement of probability of various future outcomes for the climate based on the collective behavior of the GCMs, there will be hell to pay, because GCM results are not iid samples drawn from a fixed distribution, there by fail to satisfy the elementary axioms of statistics and render both mean behavior and standard deviation of mean behavior over the “space” of perturbations of model types and input data utterly meaningless as far as having any sort of theory-supported predictive force in the real world. Literally meaningless. Without meaning.
The probability ranges published in AR4′s summary for policy makers are utterly indefensible by means of the correct application of statistics to the output from the GCMs collectively or singly.When one assigns a probability such as “67%” to some outcome, in science one had better be able to defend that assignment from the correct application of axiomatic statistics right down to the number itself. Otherwise, one is indeed making a Ouija board prediction, which as Greg pointed out on the original thread, is an example deliberately chosen because we all know how Ouija boards work! They spell out whatever the sneakiest, strongest person playing the game wants them to spell.
If any of the individuals who helped to actually write this summary would like to come forward and explain in detail how they derived the probability ranges that make it so easy for the policy makers to understand how likely to certain it is that we are en route to catastrophe, they should feel free to do so. And if they in fact did form the mean of many GCM predictions as if GCMs are some sort of random variate, form the standard deviation of the GCM predictions around the mean, and then determine the probability ranges on the basis of the central limit theorem and standard error function of the normal distribution (as it is almost certain they did, from the figure caption and following text) then they should be ashamed of themselves and indeed, should go back to school and perhaps even take a course or two in statistics before writing a summary for policy makers that presents information influencing the spending of hundreds of billions of dollars based on statistical nonsense.
And for the sake of all of us who have to pay for those sins in the form of misdirected resources, please, please do not repeat the mistake in AR5. Stop using phrases like “67% likely” or “95% certain” in reference to GCM predictions unless you can back them up within the confines of properly done statistical analysis and mere common wisdom in the field of predictive modeling — a field where I am moderately expert — where if anybody, ever claims that a predictive model of a chaotic nonlinear stochastic system with strong feedbacks is 95% certain to do anything I will indeed bitch slap them the minute they reach for my wallet as a consequence.
Predictive modeling is difficult. Using the normal distribution in predictive modeling of complex multivariate system is (as Talebpoints out at great length in The Black Swan) easy but dumb. Using it in predictive modeling of the most complex system of nominally deterministic equations — a double set of coupled Navier Stokes equations with imperfectly known parameters on a rotating inhomogeneous ball in an erratic orbit around avariable star with an almost complete lack of predictive skill in any of the inputs (say, the probable state of the sun in fifteen years), let alone the output — is beyond dumb. Dumber than dumb. Dumb cubed. The exponential of dumb.The phase space filling exponential growth of probable error to the physically permitted boundaries dumb.
In my opinion — as admittedly at best a well-educated climate hobbyist, not as a climate professional, so weight that opinion as you will — we do not know how to construct a predictive climate model, and will never succeed in doing so as long as we focus on trying to explain “anomalies” instead of the gross nonlinear behavior of the climate on geological timescales. An example I recently gave for this is understanding the tides. Tidal “forces” can easily be understood and derived as the pseudo forces that arise in an accelerating frame of reference relative to Newton’s Law of Gravitation. Given the latter, one can very simply compute the actual gravitational force on an object at an actual distance from(say) the moon, compare it to the actual mass times the acceleration of the object as it moves at rest relative to the center of mass of the Earth(accelerating relative to the moon) and compute the change in e.g. the normal force that makes up the difference and hence the change in apparent weight. The result is a pseudo force that varies like (R_e/R_lo)^3 (compared to the force of gravity that varies like 1/R_lo^2 , R_e radius of the earth, R_lo radius of the lunar orbit). This is a good enough explanation that first year college physics students can, with the binomial expansion, both compute the lunar tidal force and compute the nonlinear tidal force stressing e.g. a solid bar falling into a neutron star if they are a first year physics major.
It is not possible to come up with a meaningful heuristic for the tides lacking a knowledge of both Newton’s Law of Gravitation and Newton’s Second Law. One can make tide tables, sure, but one cannot tell how the tables would CHANGE if the moon was closer, and one couldn’t begin to compute e.g. Roche’s Limit or tidal forces outside of the narrow Taylor series expansion regime where e.g. R_e/R_lo << 1. And then there is the sun and solar tides making even the construction of an heuristictide table an art form.
The reason we cannot make sense of it is that the actual interaction and acceleration are nonlinear functions of multiple coordinates. Note well, simple and nonlinear, and we are still a longway from solving anything like an actual equation of motion for the sloshing of oceans or the atmosphere due to tidal pseudoforces even though the pseudo forces themselves are comparatively simple in the expansion regime. This is still way simpler than any climate problem.
Trying to explain the nonlinear climate by linearizing around some set of imagined “natural values” of input parameters and then attempting to predict an anomaly is just like trying to compute the tides without being able to compute the actual orbit due to gravitation first. It is building a Ptolemaic theory of tidal epicycles instead of observing the sky first, determining Kepler’s Laws from the data second, and discovering the laws of motion and gravitation that explain the data third,finding that they explain more observations than the original data (e.g. cometary orbits) fourth, and then deriving the correct theory of the tidal pseudo forces as a direct consequence of the working theory and observing agreement there fifth.
In this process we are still at the stage of Tycho Brahe and Johannes Kepler, patiently accumulating reliable, precise observational data and trying to organize it into crude rules. We are only decades into it — we have accurate knowledge of the Ocean (70% of the Earth’s surface) that is at most decades long, and the reliable satellite recordis little longer. Before that we have a handful of decades of spotty observation — before World War II there was little appreciation of global weather at all and little means of observing it — and at most a century or so of thermometric data at all, of indifferent quality and precision and sampling only an increasingly small fraction of the Earth’s surface. Before that, everything is known at best by proxies — which isn’t to say that there is not knowledge there but the error bars jump profoundly, as the proxies don’t do very well at predicting the current temperature outside of any narrow fit range because most of the proxies are multivariate and hence easily confounded or merely blurred out by the passage of time. They are Pre-Ptolemaic data — enough to see that the planets are wandering with respect to the fixed stars, and perhaps even enough to discern epicyclic patterns, but not enough to build a proper predictive model and certainly not enough to discern the underlying true dynamics.
I assert — as a modest proposal indeed — that we do not know enough to build a good, working climate model. We will not know enough until we can build a working climate model that predicts the past —explains in some detail the last 2000 years of proxy derived data, including the Little Ice Age and Dalton Minimum, the Roman and Medieval warm periods, and all of the other significant decadal and century scale variations in theclimate clearly visible in the proxies. Such a theory would constitute themoral equivalent of Newton’s Law of Gravitation — sufficient to predict gross motion and even secondary gross phenomena like the tides, although difficult touse to compute a tide table from first principles. Once we can predict and understand the gross motion of the climate, perhaps we can discern and measure the actual “warming signal”, if any, from CO_2. In the meantime, as the GCMs continue their extensive divergence from observation, they make it difficult to take their predictions seriously enough to condemn a substantial fraction of the world’s population to a life of continuing poverty on their unsupported basis.
Let me make this perfectly clear. WHO has been publishing absurdities such as the “number of people killed every year by global warming” (subject to a dizzying tower of Bayesian priors I will not attempt to deconstruct but that render the number utterly meaningless). We can easily add to this number the number of people a year who have died whose lives would have been saved if some of the half-trillion or so dollars spent to ameliorate a predicted disaster in 2100 had instead been spent to raise them up from poverty and build a truly global civilization.
Does anyone doubt that the ratio of the latter to the former — even granting the accuracy of the former — is at least athousand to one? Think of what a billion dollars would do in the hands of Unicef, or Care. Think of the schools, the power plants, the business another billion dollars would pay for in India, in central Africa. Go ahead, think about spending 498 more billions of dollars to improve the lives of the world’s poorest people, to build up its weakest economies. Think of the difference not spending money building inefficient energy resources in Europe would have made in the European economy — more than enough to have completely prevented the fiscal crisis that almost brought down the Euro and might yet do so.
That is why presenting numbers like “67% likely” on the basis of gaussian estimates of the variance of averaged GCM numbers as if it has some defensible predictive force to those who are utterly incapable of knowing better is not just incompetently dumb, it is at best incompetently dumb. The nicest interpretation of it is incompetence. The harshest is criminal malfeasance — deliberately misleading the entire world insuch a way that millions have died unnecessarily, whole economies have been driven to the wall, and worldwide suffering is vastly greater than it might have been if we had spent the last twenty years building global civilization instead of trying to tear it down!
Even if the predictions of catastrophe in 2100 are true— and so far there is little reason to think that they will be based on observationas opposed to extrapolation of models that rather appear to be failing — it is still not clear that we shouldn’t have opted for civilization building first as the lesser of the two evils.
I will conclude with my last standard “challenge” for the warmists, those who continue to firmly believe in an on coming disaster in spite of no particular discernible warming (at anything like a“catastrophic” rate” for somewhere between 13 and 17 years), in spite of an utterly insignificant rate of SLR, in spite of the growing divergence between the models and reality. If you truly wish to save civilization, and truly believe that carbon burning might bring it down, then campaign for nuclear power instead of solar or wind power. Nuclear power would replace carbon burning now, and do so in such a way that the all-important electrical supply is secure and reliable. Campaign for research at levels not seen since the development of the nuclear bomb into thorium burning fission plants,as the US has a thorium supply in North Carolina alone that would supply its total energy needs for a period longer than the Holocene, and so does India and China — collectively a huge chunk of the world’s population right there (and thorium is minded with rare earth metals needed in batteries, high efficiency electrical motors, and more, reducing prices of all of these key metals in theworld marketplace). Stop advocating the subsidy of alternative energy sources where those sources cannot pay for themselves. Stop opposing theburning of carbon for fuel while it is needed to sustain civilization, and recognize that if the world economy crashes, if civilization falls, it will be a disaster that easily rivals the worst of your fears from a warmer climate.
Otherwise, while “deniers” might have the blood of future innocents on their hands if your future beliefs turn out to be correct,you’ll continue to have the blood of many avoidable deaths in the presenton your own.
rgb
Mi Cro: I asked Dr Brown if I could repost his comments, and this was his reply, I think I have complied with his wishes, and included Nick’spost as requested.
Rgb:
I would request that you add one thing to the prologue of the repost though. Nick Stokes points out, with some reason, that 11.33a itself does not do what I assert that it does (although 11.33b does, as far as one can tell, 1.4 does as far as one can tell, so it is really a bit of a moot point). However,the Summary for Policy Makers in AR4 does
>>exactly<< what I'm discussing, and clearly states that in the figure caption, and then goes on and uses it as the clear basis for its explicit assignment of probabilities of various levels of disaster (all of them egregiously high, and all of the probabilities themselves absurd and absolutely indefensible by the use of correctly done statistics).
The main reason I posted on Monckton's list in the first place is because this sort of figure -- a graph that "hides the spaghetti" -- is >>commonplace<< in climate science, with or without a centroid that might or might be the mean, with a variance range that might or might not be a standard deviation two standard deviations or nine deciles or something else but <I>what other variancewould policy makers be even passingly familiar with?</i>. I just got sick of people on BOTH sides throwing terms around like"97% certain" or"rejected at the 95% confidence level "when they obviously do not know what they are doing or saying.
One cannot reject the GCMs at any sort of statistically defensible confidence level, but one can certainly observe that they aren't working. Not working is a discrete thing, not a probability, and the models aren't really making a statistical prediction. If they were, the correct conclusion would always be inverted -- if reality is out there in the 5%region, it makes it somewhat likely that the model is incorrect,not "95%likely that nature is incorrect" but the model is correct.
It is not correct to say that the GCMs are incorrect at some level of confidence. It is obviously correct to say that the spaghetti snarl of GCM results bear no resemblance to the actual globaltemperature over the last 13 to 30 years, either individually or collectively. It is obviously correct to say that the last 1/8 of a century (at least) of no warming at all in the 21st century is not evidence >>for<<systematic warming due to any cause at all.
My main reason for wanting this general article republished is that I hope to convince the authors of AR5's Summary for Policy Makers not to repeat the mistake. If they were truly honest, Feynman-level honest, they would indeed>>refute<< the egregious mistake of using mean and standard deviation of >>distinct model computations<< as if it had some predictive force in AR4, and apologize to the entire world for the error.
If they wish, they can publish the actual spaghetti snarl of model results compared to the measured temperatures, along the lines of Roy Spencer's recent construction that Anthony just reposted in a separate article. This figure doesn't even require a caption -- it says it all, and no statistical massaging can rescue even the casual observer from concluding that the GCMs are failing to agree with reality, and so AT THE VERY LEAST little confidence should be placed in their predictions, so far.
In the future, that might well change. In the meantime, pretending that we can somehow estimate the PROBABILITY that they will change by looking at the variance and mean of unverified MODEL PREDICTIONS is simply wrong.
rgb
Mi Cro: I realize this is a long post, and I could have edited it down, but edits allow people to take words out of context, I didn’t want to do that, I think the words will do better standing on their own. If you get this far, congratulations, hopefully this will provide some additional food for thought, which ever side of this debate you’re on.


Comments