

In the days of sailing ships and the early days of steam, even into the early years of the 20th century, much of the Arctic remained inaccessible due to the extensive pack ice.
When explorers attempted to penetrate the ice, it is often found from their journals that they did so in late August. There are many references to be found of an 'open season' during which it was possible to maneuver a ship through an open lead during a period which was often only of two weeks duration, or less. In some years, the ice simply did not open as expected, and the explorers would either go home or overwinter nearby, to try again the next year.
The explorers of even as recently as the 1930s and 40s would be astounded to see Baffin Bay so free of ice for so long during summer.
If we accept, as the perfectly normal Arctic behavior of many centuries, that ice extent should diminish in the last two weeks of August, it does not augur well for minimum extent in 2011.
Ice extent as measured by many different groups using different methods continues to track, on average, below that of 2007. The last few days have seen a degree of reduction in the rate of extent loss, so that 2011 is now in second place behind 2007 as regards daily extent, as shown by the AMSRE-E graph, below.
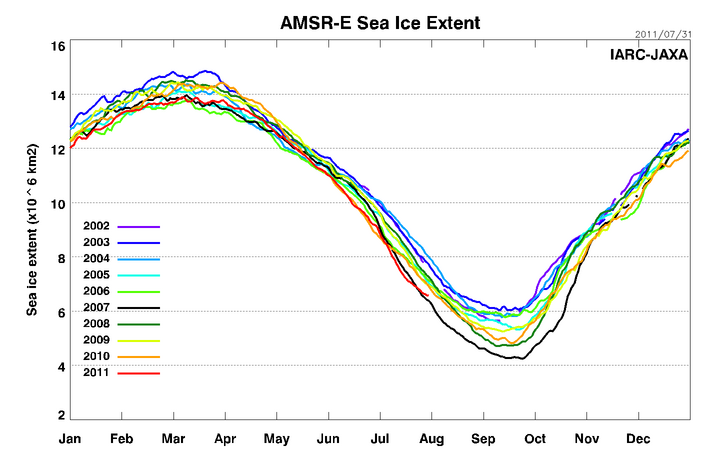
Sea ice extent August 01 2011
image source: http://www.ijis.iarc.uaf.edu/seaice/extent/
Graphs such as the one above do not give us any information about the extent and mobility in various areas. I have often remarked that mobility can give us insights into ice behavior and the likelihood of its survival. The animation below, prepared from Cryosphere Today images, shows something of the mobility of the ice, and the areas where it is likely to be thicker than average due to compression and slabbing.
Cryosphere Today animation - 12th to 29th July 2011
images source: Cryosphere Today animations index
Picture the main pack being pressed strongly against the western coasts. At the coast, the resistance of immovable land will cause ice floes to over-ride one another, in a process known as slabbing. The pressure gradient causing such slabbing will run from high at the coast to trivial at the far edge. What this gradient implies is that - broadly speaking - a complete reversal of wind would cause a reversal of the pressure gradient of wind force over the ice. The force would be strongest where the ice is least compacted and weakest where the ice is most compacted. The result of any such wind reversals will thus be to cause the most fragmented ice to disperse further.
Bear in mind also that impacts of wave on ice and ice on ice in the looser pack constitute a mechanical source of heat input, over and above the heat input from sun, air and water. Another factor to consider is that under a 24 hour sun there is no permanent natural shade. In more southerly locations a protruding ridge of ice will have a permanently shaded side and will cast a shadow over lower ice. To the north, the shadow moves in a complete circle, so nothing is permanently shaded.
The winds do not, of course, simply reverse direction: they vary. But whenever they blow on-shore they help to firm up the ice mass and whenever they blow off-shore all across the ice they help to scatter marginal ice into warmer waters.
The Cryosphere Today tale of the tape which I have often referenced continues to show a 2011 graph which broadly mimics that of 2007. These two years show graphs quite unlike those of any other year in the plot.
If 2011 continues to show ice losses reminiscent of 2007, then even a small change in conditions to one more favorable to ice loss could cause the ice extent graph to plummet once more.
The current Arctic mosaic confirms that the ice pack is heavily fragmented in areas away from the coasts of Greenland and the Canadian Archipelago. Much of that fragmented ice is very susceptible to melting, whether in situ or following dispersal.
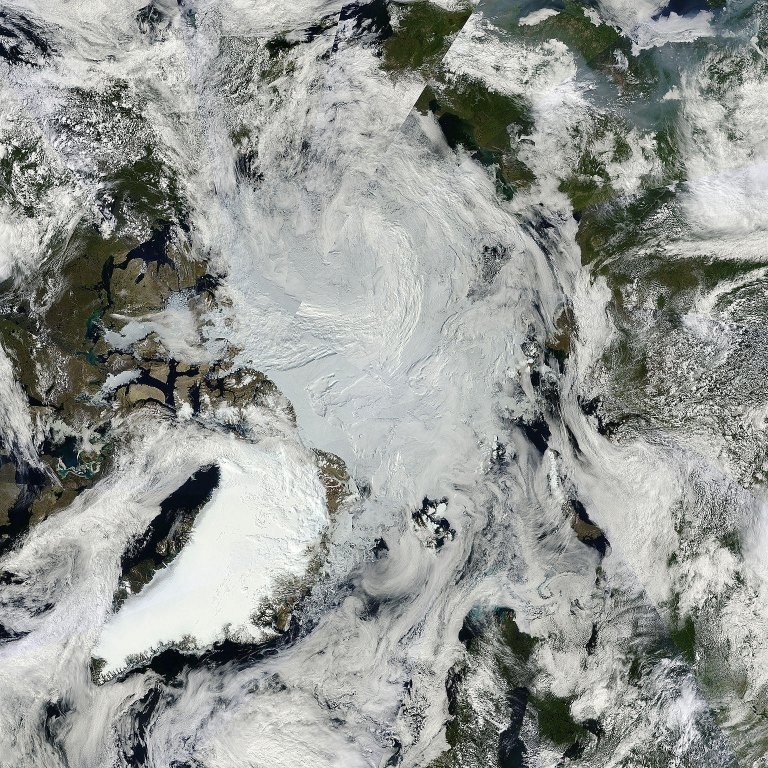
Arctic mosaic - 8km scale
original 4km scale image courtesy NASA - http://lance.nasa.gov/imagery/rapid-response/
The clouds over the NWP suggest to me a rapid melt under way. I expect this passage to be navigable within two weeks.
The shorefast ice south of Flade is likely to be adrift by the end of August. The shorefast ice and fjord sea ice north of Flade seems to be quite variable from year to year. Being adjacent to the NEW polyna - the North East Water polyna - one would think it would be very vulnerable. That would certainly be an area worth investigating.
It is well worth keeping an eye on Petermann glacier. It is by no means certain that the fissure, which extends all the way across at the surface, extends all the way across at its base. However, the great expanse of ice which is inevitably going to calve is held in place at its edges, not by great transverse compression but by a mish-mash of great icebergs and floes.
In my view, until the sea freezes again in the fjord in front of the Peterman ice tongue, there is every chance that a good gale blowing down the fjord will cause another spectacular calving event.
--------------------------------------------------
For the benefit of those with, like myself, an interest in historical observations and data, here are two isotherm charts from my copy of James Gieke's The Great Ice Age, 1877.
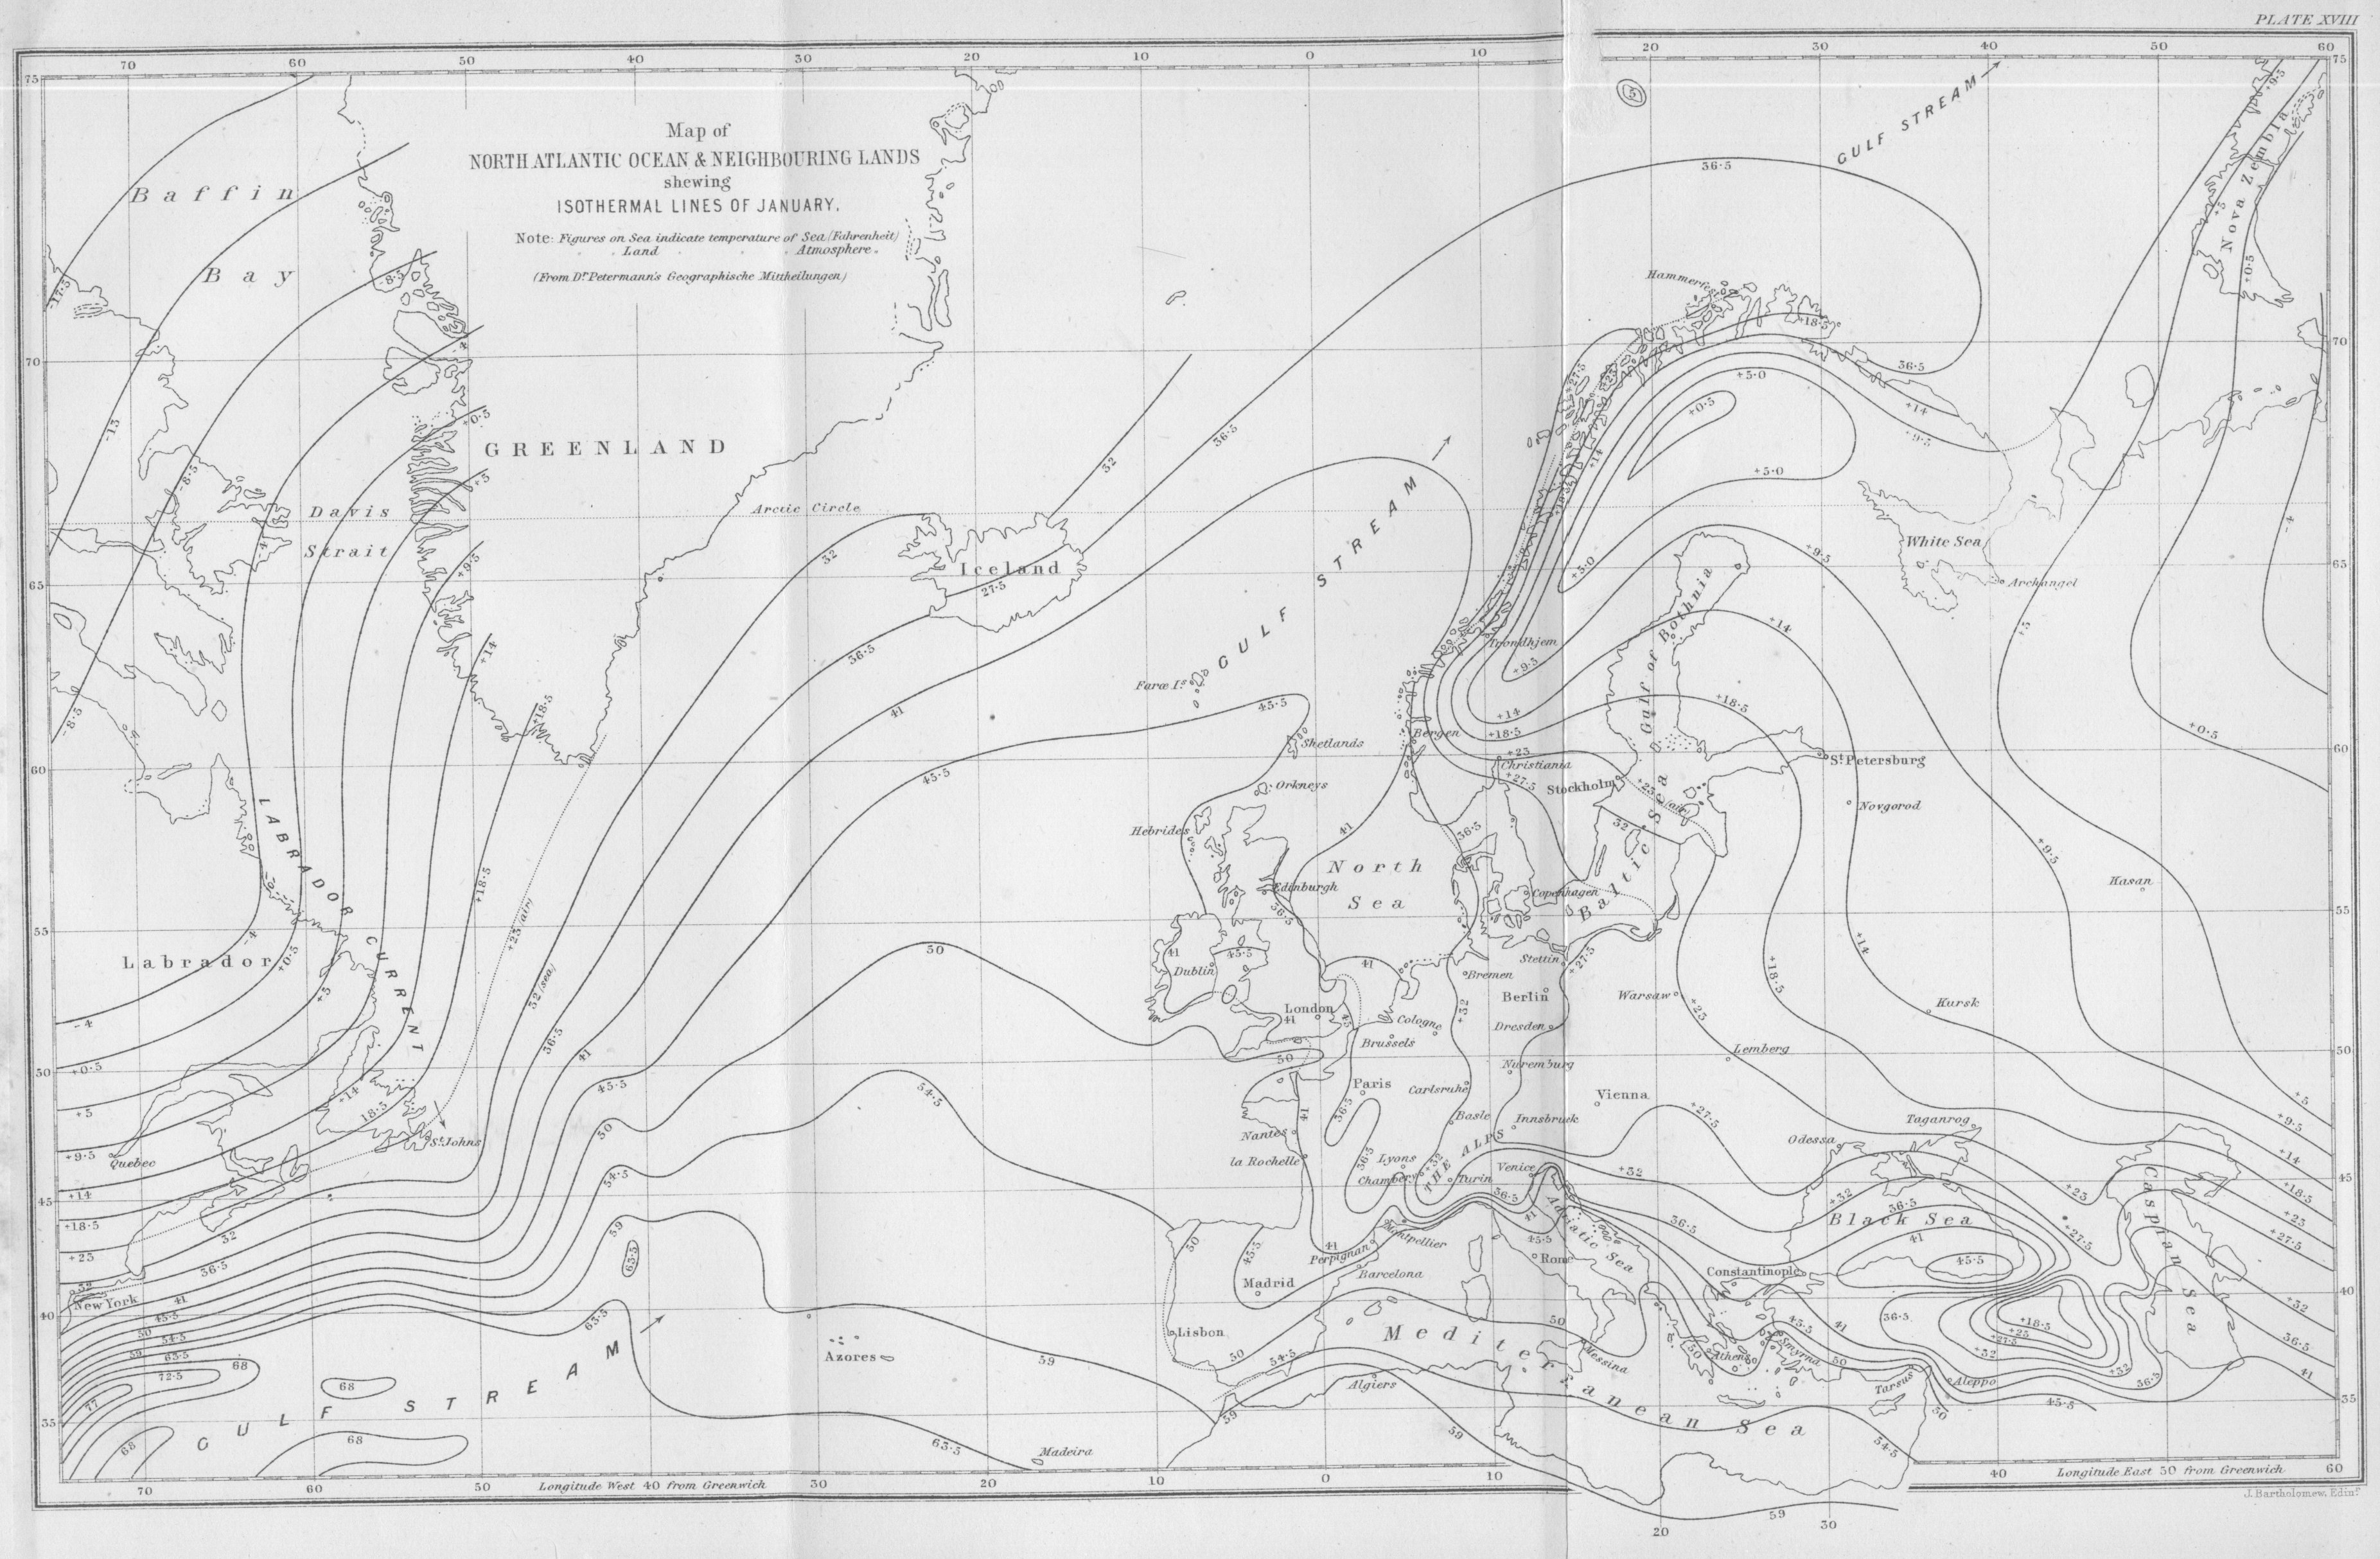
Isothermal lines January
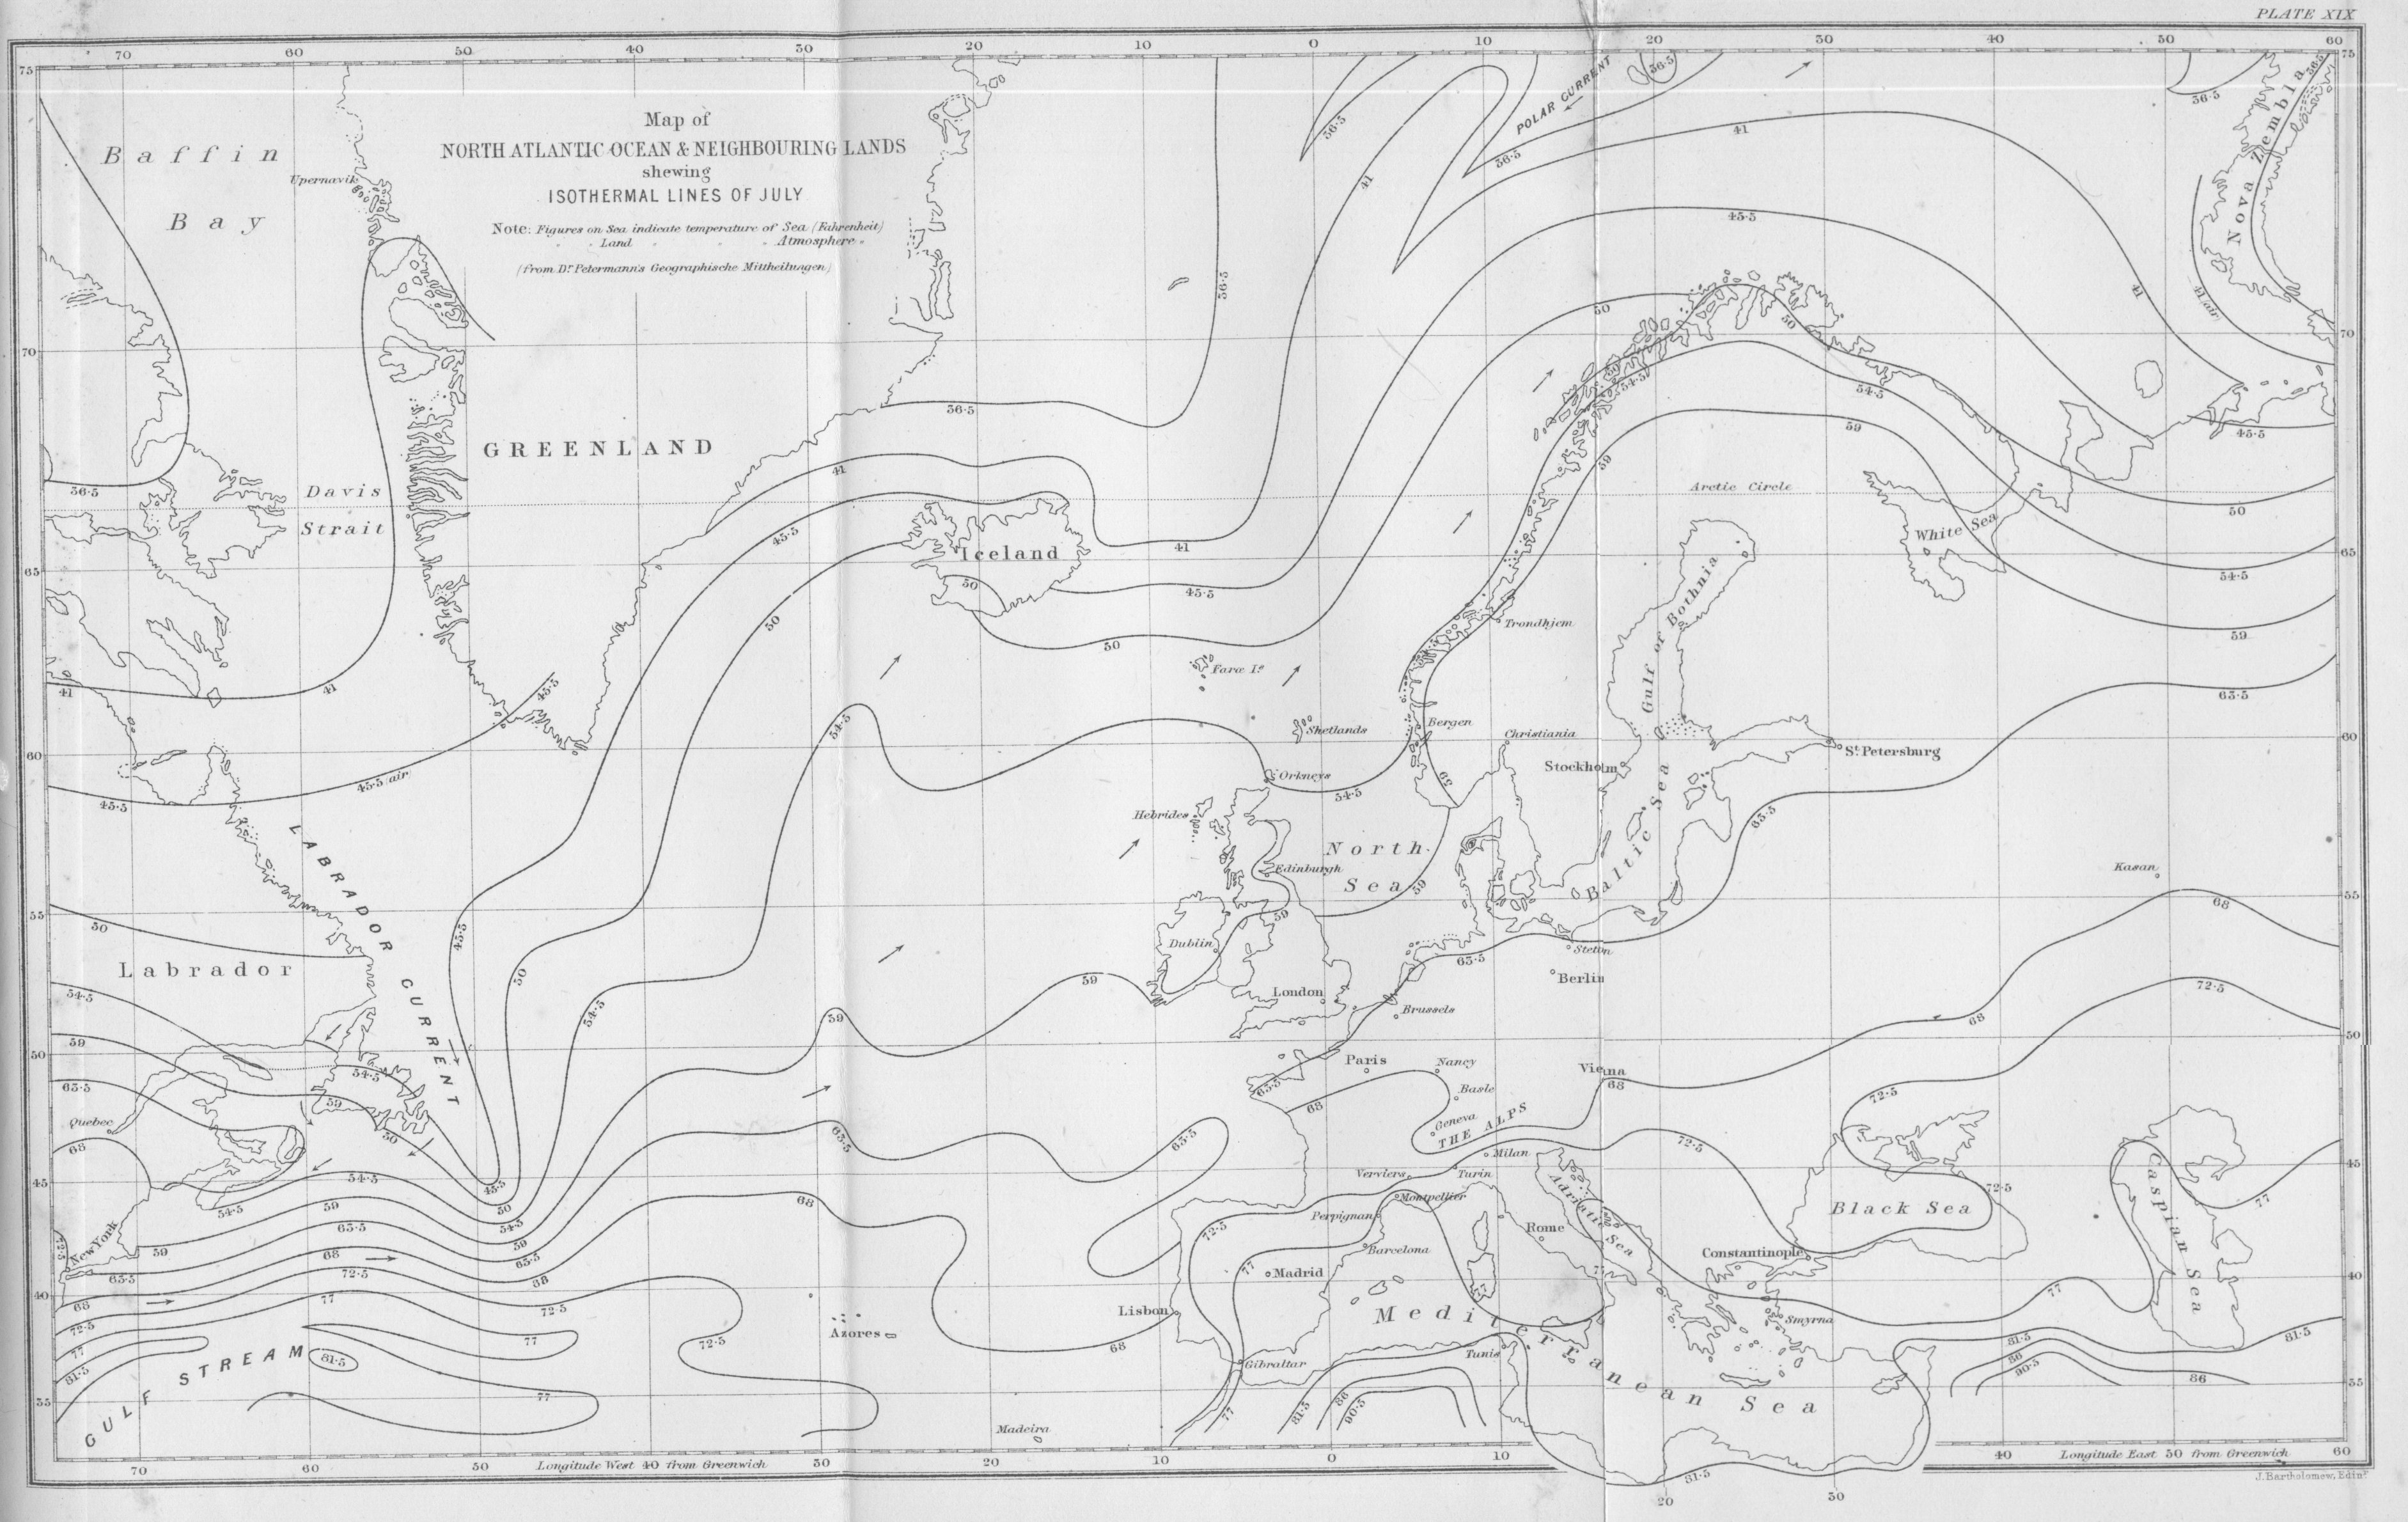
Isothermal lines July
-----------------------------------------
For regular Arctic ice updates, interesting chat and some very good scientific discussions, please visit Neven's Arctic Ice Blog.
Also highly recommended: Skeptical Science.


Comments