

In his 2010 book "Bursts," Barabasi looks at many phenomena related to dispersion, starting with Einstein's thought experiments and predictions for a power law to describe the "random" movement of dust particles in water.
Einstein's original observations (in his mind - gotta love it) showed that the distance of particle travel was related not straight to time, but the square root of the time since release. After the first observation, a particle will not move twice as far in the same time, but only half that distance. And this continues, following square roots. Graphically, the distance traveled per unit time would not be a straight line, but a flattening curve. The inverse, such as decay of radioactive particles, shows a downward slope toward an asymptote (see my chart below). Barabasi then builds out many examples where power laws hold and others where they don't.
The result is the observation that many things one might figure would decay or disperse with typical "long tail" properties (in power law fashion) broke the rules and were less predictable than expected. Barabasi uses the term "burstiness" to describe one way that using a power law can cause faulty predictions for mathematical modeling of processes: a lot of things move a little, then settle, then move a bunch again - so they don't smoothly diminish by a power of time as one would expect.
When it comes to internet hit patterns, Barabasi was able to get a hold of a database showing the internet behavior for about 60% of Hungary for a particular month. Modeling the probability of a story being "clicked" with power law math predicted that Warhol was pretty close: they thought that a story would remain famous, or of interest, on average, for 36 minutes (half-life prediction). What they found instead, when they looked at the data-set, is that their prediction was off by more than an order of magnitude. Stories did not see half of their eventual readers for closer to 36 hours, rather than minutes.
When I began to blog on science 2.0 a few months back, I decided to check my hits per story each evening, in an effort to see what worked, what seemed to be of interest for this readership, whether I grew...or lost...an "audience" over time. I didn't learn anything regarding those questions. The volume of readership does not present a pattern to me yet. But the shape of the decay curve certainly does:
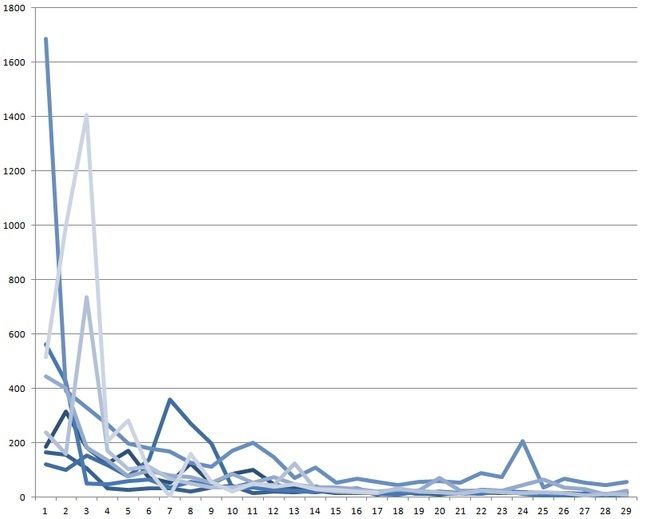
Using the term in its sloppy conventional way, the graph above has roughly a "power law" shape. You have a large initial spike of activity followed by a decay that approximately doubles in duration each time you cut it in half, until it approaches, but never reaches, zero. Rate of readership is 1/2 in 4 days, 1/4th in 16 days, etc...it's not terribly important that the "power" you raise it to is a round number, simply that it drops off quickly and has a long, one way, tail without reversing or spiking again.
It's easier to see where the half lives hit using a cumulative graph:
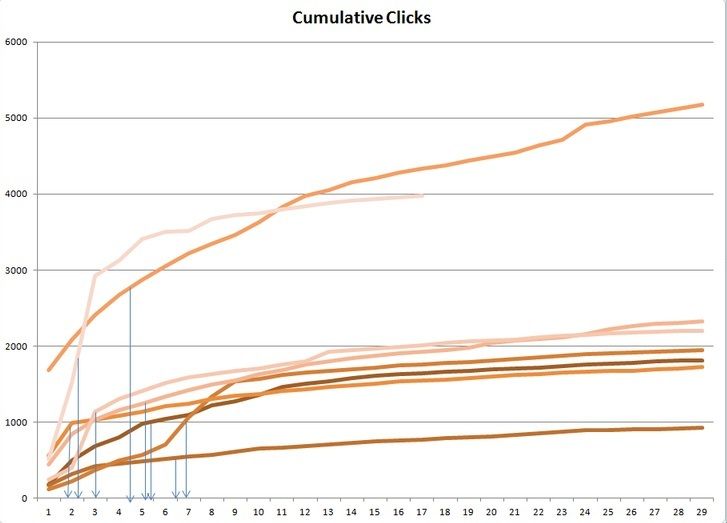
From this we see that the half life of my posts (blue arrows) on Science 2.0 is two to three times longer than that found by Barabasi. I have some speculations as to why this might be the case: This forum is curated and stories which get featured remain so for several days, encouraging more readers. Those stories are more likely to hit the top 7, which gives another "recommendation" and another place to click, so this may help skew results rightward as well (or cause some of the spikes in the first graph). This impacts on the randomness necessary for power laws to work.
On the other hand, the site is completely democratic in terms of "top billing" within each section - the newest story goes on top. This is true for the blog pieces too. I think that likely guarantees the high spike that one would expect immediately after publishing anywhere with enough web traffic.
We need to remember that "clicks" doesn't equal "reads." We have no way of knowing how many of the people who landed on a particular story read the post to its conclusion. I write long-ish pieces, mostly, reasoned like an editorial or a maybe a letter to the editor of a journal. Sometimes, I throw in anecdotes, but usually, I'm reviewing medical research. My stuff can, as one friend put it, "make your eyes glaze over." I have no idea who clicks on my articles, but from the comments I get from readers, it seems that people read at least long enough to find something with which to disagree. So that is some small comfort.
The subject of "clicks" versus "reads" was addressed in a witty 2013 piece called "You Won't Finish This Article" by Farhad Manjoo. He was writing for Slate after getting real data from Chartbeat, which is a "web traffic analysis firm" (what do you wanna be when you grow up Jimmy? I wanna be a web traffic analyzer!!). While commenting on the fact that fewer and fewer people are actually reading his article as it goes on, he noted that after a few hundred words, only half of those who didn't immediately bounce off the story would still be reading.
In terms of pixels on a screen, readers on Slate were averaging one mouse scroll more than a screen, an extra paragraph in most cases. I think he made other important points, but...and I'm not making this up...I didn't finish the article.
My more hopeful explanation for the longer half life of my stories is that they deal with more complex issues than those that expire in 36 hours...perhaps engaging a more thoughtful, intelligent audience due to the general nature of the Science 2.0 culture.
But doubling the 36 hour half life is nothing. When it comes to actual medical research, the longevity pattern is entirely different. For the typical article in a top medical journal such as New England Journal or Lancet, the half life is closer to two or three years. In a 2014 article in Library Journal, Ian Chant based a half life analysis on how many times particular articles were downloaded, rather than "clicked on." This, of course, is a measure of the seriousness of the reader in question and that would be expected to change the results, but the time difference is remarkable.
It seems that when we are doing real research, the internet hasn't done much to change what is relevant, or how long it stays so.
When talking of whole journal issues and how long they are useful, only three percent of journals hit a half-life within a year. This is to say that 97% of individual issues of top journals still had more than half of the eventual readers coming after 12 months. This suggests that very few people are reading journals as monthly installments at all. Rather, most readers are interested seekers, working on specific topics, at any given time. What the journals find new and exciting in a certain week is not what academics are necessarily reading.
How does this relate to my examination of my own articles on Science 2.0? Well, it tells me I might want to tighten up a little. I might not want to "bury the lead" so deep into the story. I might want to write more like a journalist. Or maybe not. Perhaps the true medical literature gives me something to shoot for. If I see my half lives grow over time, I will know I'm doing something right.
Looking at my graphs, my take-away is that a story is basically "dead" after about two weeks here. I will use that keep to my habit of publishing on a regular interval. For next week (I believe the journalists call this a teaser - look out), I'm working on a part-two to this story, with an examination of disappearing online references.


Comments