

So the plot whose meaning is to be guessed is shown below. It has enough distinctive features that it should be possible to guess exactly what it is about, but of course I accept even imprecise answers and plain guesswork.
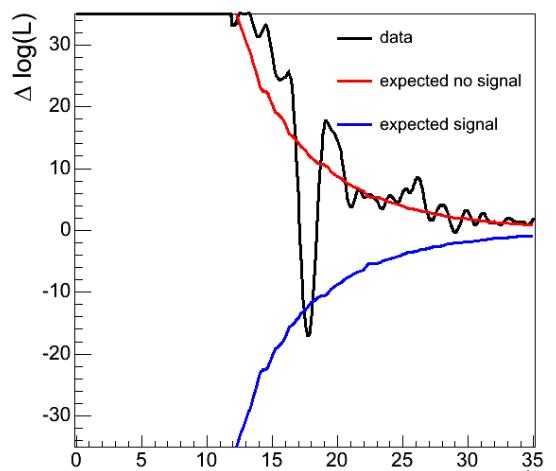
So as you see, this is a plot showing a signal - the red and blue lines are clearly described in the legend, and the vertical axis shows a "delta log L" label which is quite explanatory -it tells you this is a log-likelihood ratio curve of some data (in black) compared to two different hypotheses (in red and blue). But what exactly distinguishes the hypotheses ? Why the blue one is good only for a value of the x-axis parameter ? And what is that parameter after all ?
I will post an explanation in a couple of days, after at least a few of you have tried your luck in the comments thread below... Please don't be shy! Physics is fun!


Comments