

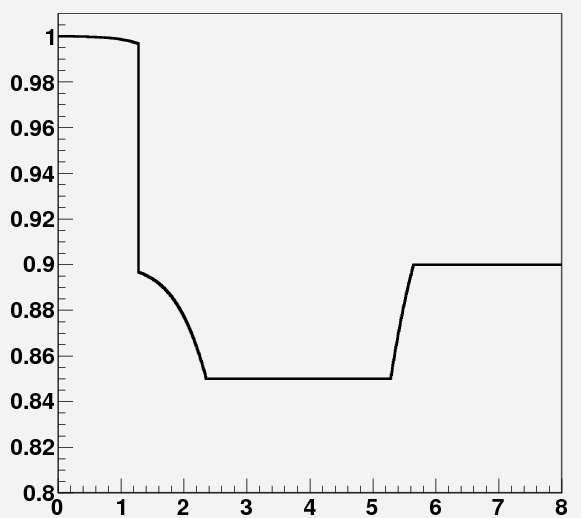
So the question is: what does the picture below represent ?
A few hints:
- I did the graph myself, and it took me 10' of programming and a tenth of a second of CPU on my laptop.
- It does not strictly have to do with physics, although it is very relevant to experimental particle physics, especially new searches
- This particular version of the figure might not have published anywhere before (but I am not sure): I certainly never saw it around before creating it.
- The interest of the graph is that it is not a flat line.
- Not many people understand its meaning (although you will be among them in a couple of days, if you come back to read the solution).
Now it's your turn to shoot an answer. Don't be shy, use the comments thread below, and remember that unfortunately not many even among my colleagues know what this represents. If, on the other hand, you recognize its general features at a glance, write what it is -you won't be spoiling the game to other readers anyway, I don't think.


Comments