

If you never experienced such a feeling, this post is not for you. In fact, there is a rule of thumb that says that if you walk in an internet conversation and you can't immediately identify the most incompetent guy or gal, there is a good chance that it is you. Which is perfectly fine, mind you - we are all ignorant on some topic, either because we never had to study it or because we really do not find it interesting or worth our time. But knowing that you are an ignorant on some specific topic is very important, as it is the foundation of healthy learning and it prevents you from unwittingly spreading misinformation. Alas, that kind of self-awareness seems to be not at all that common, if we look around. People look like they believe they know a bit more than everybody else, whatever the topic.
The DK effect
The Dunning-Kruger effect summarizes the above behaviour, by explaining that it is a cognitive bias that brings people with limited knowledge on a topic to think they know more than they actually do. And specularly, there also seems to be a similar bias in the opposite direction from individuals who are highly knowledgeable. The effect was first formulated by the social psychologists Dunning and Kruger in 1999, in a paper titled "Unskilled and Unaware of It: How Difficulties in Recognizing One's Own Incompetence Lead to Inflated Self-Assessments".
The wikipedia entry on the topic is very informative, so I suggest you to give a look there for details, discussion, and references. Here, on the other hand, I want to concentrate on a recent article by some Jonathan Jarry, who claims that the effect is an artifact due to misinterpretation of the data.
Jarry's piece
The article by Jarry is entertaining but highly deceiving. After reading it, I was left with the clear impression that the author is a good example of the genuine nature of the very effect whose existence he denies. I get this impression from reading sentences such as the following:
"While trying to understand the criticism that had been leveled at the original study, I fell down a rabbit hole, spoke to a few statistics-minded people,"
Alas, if somebody writes about statistical interpretations of data, can we expect that he or she knows about it, rather than to just have spoken to statistically-minded people? Apparently not. In fact, later on the author discusses regression to the mean, which indeed has relevance to the whole issue, by explaining that
"as Patrick McKnight points out, regression to the mean occurs when the same measure is taken over time and we track its evolution. If I take my temperature every morning and one day spike a fever, that same measure will (hopefully) go down the next day and return to its mean value as my fever abates. That’s regression to the mean. But in the context of the Dunning-Kruger effect, nothing is measured over time, and self-assessment and performance are different measures entirely, so regression to the mean should not apply."
Note that not only is his example of fever measurements problematic (the mean temperature is not a constant, but it in fact varies due to fever or other conditions, so one cannot apply regression to the mean to a non-constant mean -indeed, in case the fever is due to a real flu, it is reasonable to expect that the second day the temperature will have further raised, as the infection progresses!), but regression to the mean does not necessarily have to do with "measurements over time", although it applies there as well. Jarry is twice at fault in a single sentence, another proof that he is overestimating his abilities.
But enough criticism. Basically all that the longish piece tries to sell is the observation that what was originally measured by Dunning and Kruger in their paper can qualitatively be replicated with simulations without any injection of a real DK effect. Which of course is no proof that the effect does not exist. The fact that statistical simulations are brought in to study how an effect similar to the one seen by DK may arise is a bit ridiculous, as the matter has a very simple, quite intuitive I would say, mathematical explanation. What's more, these "simulations" can be produced in the matter of 5 minutes of coding (no kidding, see below - it took me a bit less than that, but 5 minutes should be a good estimate as I'm a fast kid).
Digging in the matter
First of all, what we are talking about is some ability T, say measured between 0 and 1 (the range is totally unimportant), possessed by individuals, and a perceived value P of the same ability, again assessed between 0 and 1. If somebody has T=0.2 and he assesses it as P=0.4, he is overconfident on that ability; if on the other hand somebody with T=0.6 assesses its ability at P=0.3, he is underestimating himself. The Dunning-Kruger effect was measured by the authors by dividing individuals in four quartiles of T (those with real values of T in the 0%-25% range, those in the 25%-50% range, those in the 50%-75% range, and those in the highest 75%-100% quartile), and computing for each class the average percentile of perceived ability. What they saw is that while the average P did increase with the quartile as expected, there was a significant bias: the individuals in the first quartile -the least skilled- highly overestimated their score. The original graph is the one reported below.
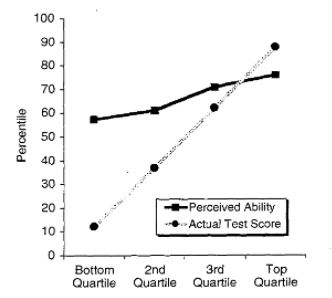
Now, such an effect may be real (a positive bias in P at low values of T, and a negative bias in P at high values of T) or spurious. Observing that one may indeed produce similar results if the bias is absent is no ruling out of the effect; it does, however, call for more information on the correlation of P and T before one can judge.
It was very surprising for me to learn that it takes people a simulation to prove to themselves that an analysis of percentiles (or mean values of P and T, for that matter) lends itself to a bias; but for somebody who needs to inquire with "statistics minded people" this is after all understandable. The basic effect is the following: if you are at the bottom of the spectrum of T, you have fewer chances to underestimate your ability (in terms of percentile of your score in a population) than to overestimate it, so the average of your estimate is biased high; and the opposite happens at the other end of the spectrum. Doh.
However, I promised a 5' simulation. Ok, so to get some insight let us simulate individuals with some T in [0,1] and a corresponding P drawn at random from a Gaussian distribution centered at T. What that means is that each individual is allowed to over- or underestimate his or her ability by the same amount, and there is no bias. However, when one computes percentiles, things change (they would also if the perceived scores were forced to also be in the [0,1] range, but let's forget this ancillary detail). To see how, let us write a simple program. Really, a five-minutes business - it took me much more to write this piece around it!
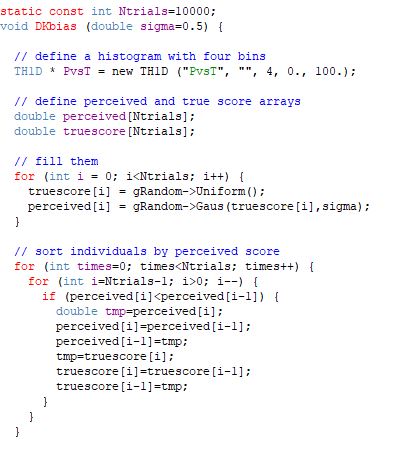
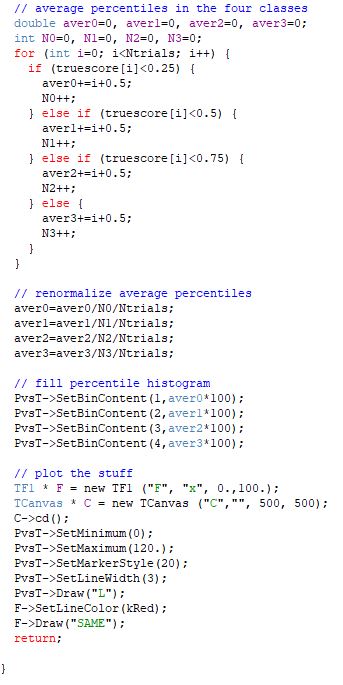
I use the root package (root.cern.ch) to help myself with easy graphical plotting libraries, but that's a detail - if you change the histogramming instructions above you can get a C or C++ program with the same structure. Anyway, as you see there is nothing magical - basically, the code draws random scores for a set of 10000 individuals with uniformly distributed true abilities in [0,1] (what the gRandom->Uniform() call does), and then for each a perceived score is obtained from a Gaussian distribution centered at the true ability, with a width defined by the user as a pass parameter. Then one just need to reorder the individual by their perceived score, so that one can derive average percentile of perceived score in the four classes of true abilities (0:0.25, 0.25:0.5, 0.5:0.75, 0.75:1). No rocket science.
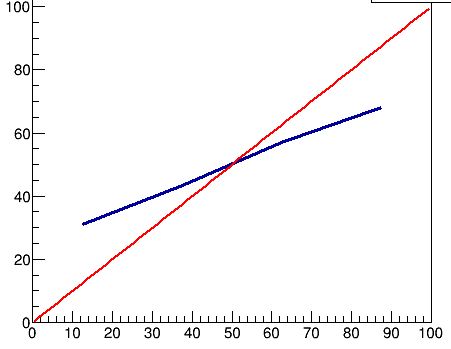
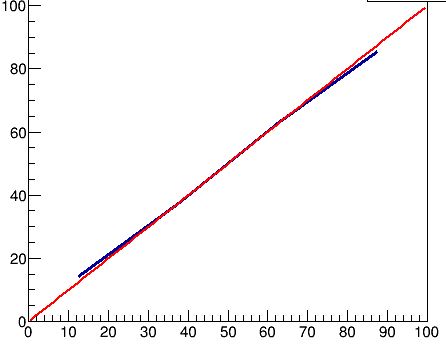
The result, for sigma=0.5, is the one shown below. It is the blue line, which goes through four points laying at the center of each of the four bins on the x axis. The red line is a reference that shows what the percentiles should be if there were no bias (remember, here we are talking about random biases due to the way we are analysing the data - no DK effect assumed).
One should also notice how, for sigma=0.1, the bias is a lot smaller - it helps if individuals have a much better hunch at their perceived ability - see below.
Executive summary
What to get from the above graphs? Well, to me it is self-evident, but let's summarize:
1) the plotting of percentiles of perceived ability in bins of quartiles of true ability produces a biased result - the bottom quartile will show a mean percentile of perceived ability higher than the true value, because of the larger "phase space" available for overestimates; the opposite occurs at the other end;
2) In order to ascribe to this effect biases such as those of the graph in the original DK paper, the (im)precision with which individuals rate their own abilities must be very large. If, e.g., one scores the ability in the [0,1] range, a 10% precision in assessing one's scores will produce almost no bias in the percentiles plot (see last graph above). In order to display a behaviour such as the original DK one, we have to assume that individuals are terribly bad at self-assessment, as a sigma of 0.5 does not even come near to "flattening" the slope of the P vs T curve. My simulation indicates that to get that effect one needs a sigma of 1 or so, which is to say that there's a significant chance that an individual with ability 0.5, e.g., will think he has ability -0.5 or +1.5 (which are outside the range, but I'm just saying).
3) The original DK graph shows that the line is systematically above the reference curve. This indicates that all individuals overestimate their capabilities, and no amount of "noise" (as Jarry calls the error in self-assessment) can produce that result. That, by itself, is an interesting observation, which basically already constitutes part of the DK effect in its own right.
In any case: the DK effect remains a very interesting area of sociological research, and for sure no "simulation" of what can be obtained anyway with third-grader math can prove anything - of course, it remains true that the way of presenting the data chosen by Dunning and Kruger is a bad idea.


Comments