


Simon et al. (2017) changed all of that. Using ASAS/ASAS-SN data, the researchers documented two apparent episodes of brightening in the last 11 years. It now seems Boyajian's Star has long-term variability that is likely periodic.
Since the apparent amplitude of the long-term magnitude signal is not small, it's reasonable to expect it should show up in century-long data, despite the noisy nature of this data. I have confirmed this expectation with simulations.
I'm making the source code that I used in this analysis available on GitHub.
Data
I will be using light curve data from the DASCH Kepler Input Catalog (g-band). I removed only one data point from it — the biggest outlier — as it improves cross-validation.
I added Sonneberg Observatory data provided by Michael Hippke on GitHub. I'm using the stata_output_pg.csv file. In this case, I'm removing 2σ outliers, as that seems to improve the model in cross-validation.
That's 2066 data points in total.
I am not using data from the DASCH APASS Input Catalog (B-band), even though it has a couple thousand data points. It not only reduces model performance in cross-validation, but it seems to have different statistically significant periodicity, which should be studied separately.
Periodicity
I found one period (7.29 years) that has a statistically significant peak in a Lomb-Scargle periodogram. In addition to this, a sinusoidal model that also includes periods of 4.12, 5.46, 8.19 and 10.90 years exhibits improved performance in cross-validation.
Let's take a look at the Lomb-Scargle (LS) periodogram of the data. An LS periodogram is designed to deal with the problem of non-uniform distribution of observation timestamps.
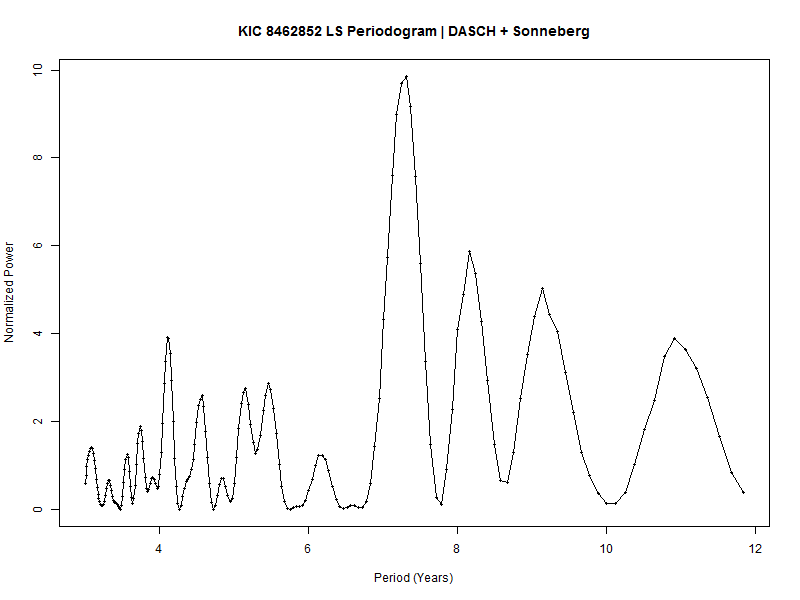 One thing no periodogram can prevent is the presence of bogus peaks due to noise. In simulations with similarly noisy synthetic data, it's clear that while real peaks are prominently visible, bogus peaks also show up. In our periodogram of century-long data, we should expect that some of the peaks we see are bogus. The peak at 7.29 years is significant, and I will discuss statistical significance shortly.
In order to select other peaks that are likely predictive, I averaged 50 10-fold cross-validation runs of models that combine multiple periods. Cross-validation is a technique used in Machine Learning to evaluate a model with data that wasn't used in training ("out of bag" data) but still use all existing data to evaluate the model. The technique is often applied in variable selection, and that's essentially what I used it for.
Cross-validation doesn't guarantee a selected model/variable is significant or reflective of the Ground Truth, but it's more likely than not that a model which performs well in cross-validation will also generalize well.
I considered possible periods of 7.29, 8.19, 9.18, 4.11, 4.40, 10.90, 5.46, 5.14, 4.56, and 6.17. I tested combinations of these periods (see the multiCrossValidationEvaluation function) incrementally, keeping and discarding periods based on results. That's how I came up with the 5 periods I previously outlined.
Statistical significance
I generated 500 simulated series of synthetic data that contain noise similar to that found in century-long data. No signals were added to the simulated series. I then checked the distribution of the maximum peak of LS periodograms equivalent to the one I produced with actual data. Normalized power above ~ 7.2 is found in about 5% of simulations. Thus, 7.2 is a good approximate threshold for standard statistical significance. When normalized power is greater than 9, we can talk about statistical significance with over 99% confidence.
Orbital resonance
The orbital periods we selected with cross-validation could be interpreted as periods of orbits that are in resonance with one another:
- (A) 4.12
- (B) 5.46
- (C) 7.29
- (D) 8.19
- (E) 10.90
- (A) 8:3 (0.8% error)
- (B) 2:1 (0.2% error)
- (C) 3:2 (0.3% error)
- (D) 4:3 (0.2% error)
- (E) 1:1
There's a major problem with this idea, however: Those families don't have very many asteroids. Most asteroids avoid those resonances with Jupiter. These mostly asteroid-free zones are called Kirkwood Gaps.
Despite this considerably difficulty, it seems reasonable to conclude the most massive element of the outer stellar system (a Jupiter analog) inhabits an orbit of 10.90 years, and there's an additional reason why I say that.
Why a major dip period of 4.31 years still makes sense
Based on matching of dips observed in 2017 (Elsie, Celeste, Skara Brae and currently unnamed dips) with dips observed in 2013 by the Kepler telescope, a period of 1573 days (4.31 years) has been proposed.
If major dips like D1519, D1540 and D1568 are caused by transits in an orbit that doesn't include a lot of other material, they wouldn't be expected to show up in a periodogram of noisy century-long data, or even in folded data. This assertion is testable.
Now, if we consider our hypothesis of a Jupiter analog in an orbit of 10.90 years, then an orbit of 4.31 years is in 5:2 resonance (1.1% error) with the Jupiter analog. In our solar system, this is equivalent to the resonance between Jupiter and Saturn.
Proposed system configuration
- A Jupiter analog with an orbit of 10.90 years, at 5.54 AU. We haven't necessarily seen a transit of this planet, but its Trojan asteroids are dusty, and this is apparently detectable.
- An asteroid belt that is similar to ours, except it contains a substantial amount of dust we can detect in orbits that should correspond to Kirkwood Gaps, as opposed to where asteroids should be. Dusty zones are:
- A thin zone at 2.90 AU, with a period of 4.12 years.
- A zone at 3.49 AU, with a period of 5.46 years.
- A dense zone at 4.24 AU, with a period of 7.29 years.
- A zone at 4.58 AU, with a period of 8.19 years.
- A large and unusual transit or set of transits orbiting in formation at 2.98 AU, with a stable orbital period of 4.31 years. This orbit is in the inner stellar system, probably at the inner edge of the asteroid belt.
ETI Hypothesis - An Argument
The system configuration I just proposed is consistent with the data we analyzed, the way our own solar system is configured, and independent observations of major dips. That said, let me outline the problems I see with it:
- The long-term variability of Boyajian's star is highly unusual. The "observed behavior of our target star is unique compared to all the comparison stars on the same detector" (Montet and Simon, 2016).
- To the extent that the long-term variability results from transiting material, that material would have to be mostly micron-sized dust (Meng et al., 2017). Note that in the proposed system configuration, transits that produce major dips are far away from the most dense dusty orbits. The circumstellar dust is dense enough to be detected, but I'm claiming it's not what produces major dips. We're not talking about a circumstellar disk of material like that of, say, EPIC 204278916.
- The long-term variability may be unique, but so are major dips. Again, I'm claiming the unique phenomena are occurring largely in very different orbits. Yet, because both phenomena are so unique, it's reasonable to suppose a common underlying mechanism is responsible for both.
- The enormous transit or transits that produce what we call major dips don't appear to be gravitationally dominant in the system.
Under an Extraterrestrial Intelligence (ETI) hypothesis, these problems seem resolvable in a manner that is not very contrived.
First, asteroid mining is an activity you would expect any nascent spacefaring civilization to engage in. It's a relatively easy way to obtain abundant mineral resources, and our own civilization is contemplating it. There are countless papers on this. Perhaps there's a reason why dust resulting from asteroid mining would distribute in orbits corresponding to Kirkwood Gaps.
Second, it comes to reason an ETI would place its megastructures in the inner solar system. The megastructures don't have to be in the habitable zone for planets per se. They can be a little further out. It also comes to reason that an ETI would want the megastructures to be reasonably close to the asteroid belt. Presumably that's where the material to build the megastructures is obtained from.
The transits that produce major dips seem large, but an analysis of the light curves suggests they are mostly diffuse. They are likely not opaque objects. They could be swarms of relatively small objects. In any case, materials used to build space modules and tie them together would need to have a very high tensile strength to weight ratio. It would not be surprising if "megastructures" are not gravitationally dominant in a system.
Summary
We find one statistically significant periodogram peak in century-long data of Boyajian's star, at a period of 7.29 years. Additional periods that improve model performance in cross-validation (more likely to be predictive than not) are 4.12, 5.46, 8.19, and 10.90 years. If we use the period of 10.90 years as a reference (a Jupiter analog) we find resonances of 8:3, 2:1, 3:2, and 4:3, which are reminiscent of resonances observed in our own solar system, except in mostly asteroid-free Kirkwood Gaps in the main asteroid belt. Additionally, we find that a period of 4.31 years for major dips would have a 5:2 resonance (1.1% error) with our proposed Jupiter analog. The unusual and large transits that produce major dips would have to be located in the inner stellar system, perhaps at the edge of the asteroid belt, in an orbit with semi-major axis of 2.98 AU. Because major dips are unique and the long-term variability is unique, we suggest both phenomena must have a common underlying mechanism, despite largely occurring in different orbits.
References
Joshua D. Simon et al. (2017). Where Is the Flux Going? The Long-Term Photometric Variability of Boyajian's Star. arXiv:1708.07822
Benjamin T. Montet and Joshua D. Simon (2016). KIC 8462852 Faded Throughout the Kepler Mission. arXiv:1608.01316
Huan Y. A. Meng et al. (2017). Extinction and the Dimming of KIC 8462852. arXiv:1708.07556


Comments