


Observations from NASA’s Cassini spacecraft have been used to build, for the first time, a 3-D picture of the sources of intense radio emissions in Saturn’s magnetic field, known as the Saturn Kilometric Radiation (SKR).
Saturn Kilometric Radiation is the most intense component of radio emissions from Saturn. It was discovered by NASA’s Voyager spacecraft in 1980. The radio emissions have frequencies between about 10 kilohertz and 1.2 megahertz. This corresponds to the Long Wave and Medium Wave broadcasting bands.
The results were presented by Dr Baptist Cecconi, of LESIA, Observatoire de Paris, at the European Planetary Science Congress on Tuesday 23rd September.
The SKR radio emissions are generated by high-energy electrons spiralling around magnetic field lines threaded through Saturn’s auroras. Previous Cassini observations have shown that the SKR is closely correlated with the intensity of Saturn’s UV aurora and the pressure of the solar wind.
The measurements were made using Cassini’s Radio and Plasma Wave Science (RPWS) experiment.
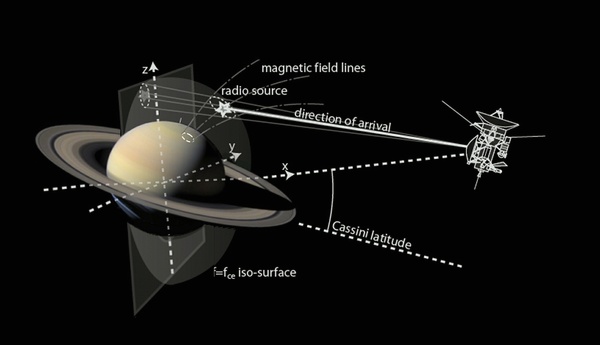
“The animation shows radio sources clustered around curving magnetic field lines. Because the radio signals are beamed out from the source in a cone-shape, we can only detect the sources as Cassini flies through the cone. When Cassini flies at high altitudes over the ring planes, we see the sources clearly clustered around one or two field lines. However, at low latitudes we get more refraction and so the sources appear to be scattered,” said Dr Cecconi.
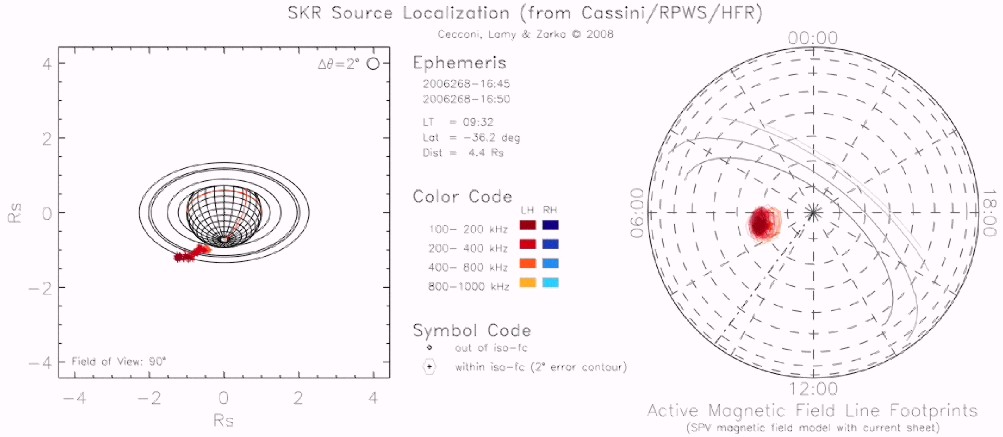
The model found that the active magnetic field lines could be traced back to near-polar latitudes degrees in both the northern and southern hemisphere. This matches well with the location of Saturn’s UV aurora.
“For the purposes of the model, we’ve imagined a screen that cuts through the middle of Saturn, set up at right-angles to the line between Cassini and the centre of the planet. We’ve mapped the footprints of the radio sources projected onto the screen, which tilts as Cassini moves along its orbital path and its orientation with respect to Saturn changes. We’ve also traced the footprints of the magnetic field lines back to the cloud tops of Saturn,” said Dr Cecconi.
Although there were some minor differences between emissions in the northern and southern hemispheres, the emissions were strongest in the western part of Saturn’s sunlit hemisphere. This area corresponds to a region of Saturn’s magnetopause where electrons are thought to be accelerated by the interaction of the solar wind and Saturn’s magnetic field.
The observations were made over a 24-hour period during Cassini’s flyby of Saturn on 25-26th September 2006. This flyby was chosen because Cassini would approach from the southern hemisphere and swoop out from the northern hemisphere, allowing the instruments to take measurements from about 30 degrees below to about 30 degrees above the equatorial plane.


Comments